Ctrl+K
Logo image Logo image
  • Types de parcelles
  • Exemples
  • Tutoriels
  • Référence API
  • Guide de l'utilisateur
  • Contribuant
  • Plot types
  • Examples
  • Tutorials
  • Reference
  • User guide
  • Develop
  • Release notes

Section Navigation

  • De base
    • parcelle(x, y)
    • dispersion (x, y)
    • barre(x, hauteur)
    • racine(x, y)
    • étape(x, y)
    • fill_between(x, y1, y2)
    • stackplot(x, y)
  • Tracés de tableaux et de champs
    • imshow(Z)
    • pcouleurmesh(X, Y, Z)
    • contour(X, Y, Z)
    • contourf(X, Y, Z)
    • barbes(X, Y, U, V)
    • carquois(X, Y, U, V)
    • diagramme de flux(X, Y, U, V)
  • Graphiques statistiques
    • hist(x)
    • boîte à moustaches(X)
    • barre d'erreur (x, y, yerr, xerr)
    • parcelle de violon(D)
    • tracé des événements (D)
    • hist2d(x, y)
    • hexbin(x, y, C)
    • tarte(x)
  • Coordonnées non structurées
    • tricontour(x, y, z)
    • tricontourf(x, y, z)
    • tripcolor(x, y, z)
    • triplot(x, y)

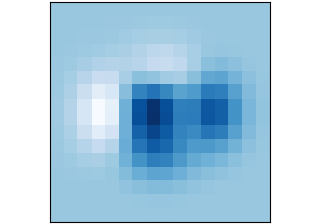
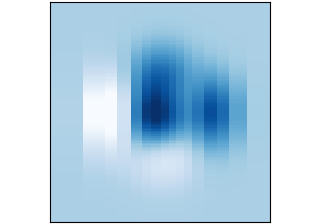
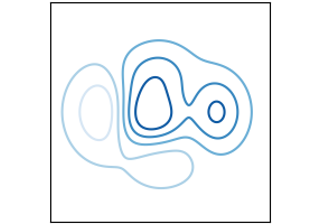
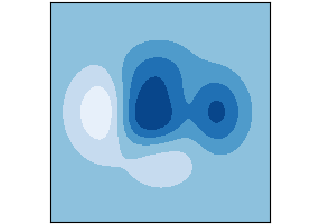
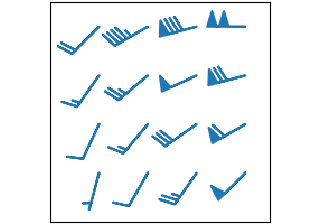
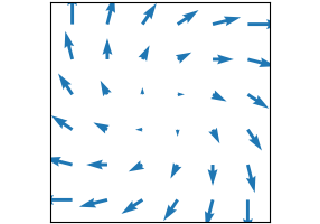
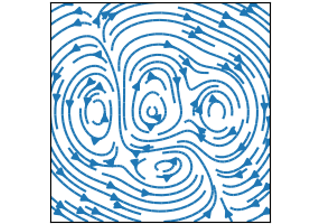
Tracés de tableaux et de champs #

Tracer des tableaux de données et de champs .Z(x, y)U(x, y), V(x, y)

imshow(Z)

imshow(Z)

imshow(Z)
pcouleurmesh(X, Y, Z)

pcouleurmesh(X, Y, Z)

pcouleurmesh(X, Y, Z)
contour(X, Y, Z)

contour(X, Y, Z)

contour(X, Y, Z)
contourf(X, Y, Z)

contourf(X, Y, Z)

contourf(X, Y, Z)
barbes(X, Y, U, V)

barbes(X, Y, U, V)

barbes(X, Y, U, V)
carquois(X, Y, U, V)

carquois(X, Y, U, V)

carquois(X, Y, U, V)
diagramme de flux(X, Y, U, V)

diagramme de flux(X, Y, U, V)

diagramme de flux(X, Y, U, V)
Afficher la source

© Copyright 2002–2012 John Hunter, Darren Dale, Eric Firing, Michael Droettboom and the Matplotlib development team; 2012–2022 The Matplotlib development team.

Created using Sphinx 5.1.1.