Noter
Cliquez ici pour télécharger l'exemple de code complet
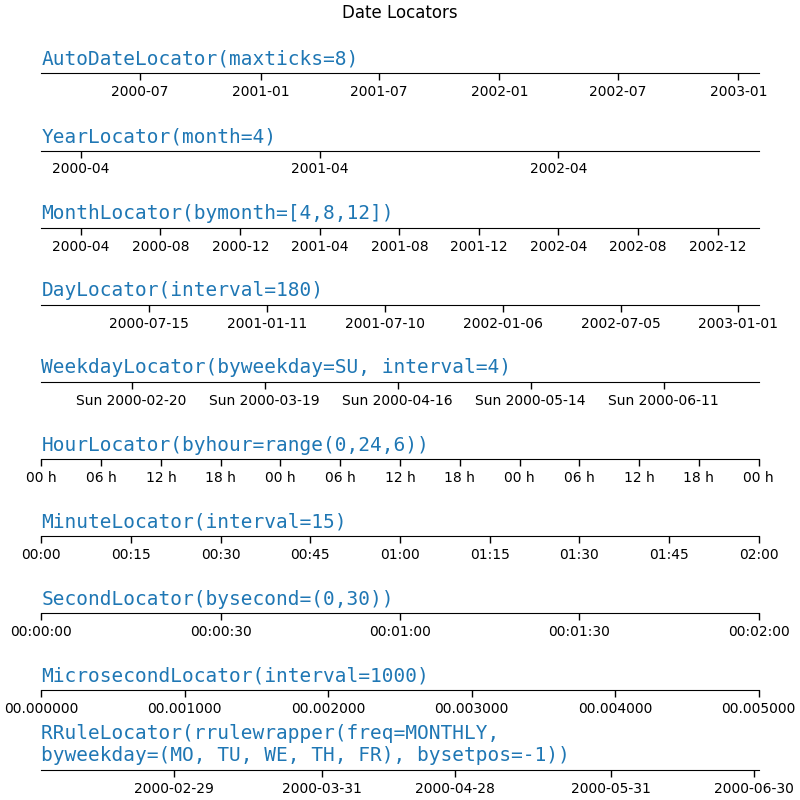
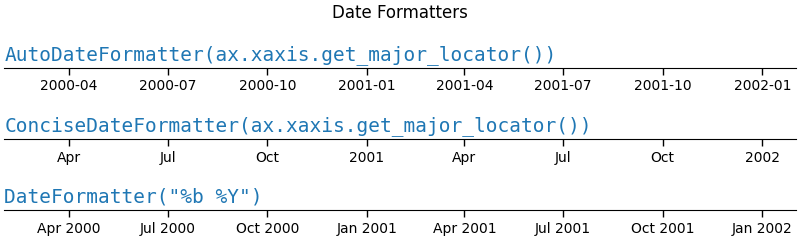
Localisateurs et formateurs de dates #
Cet exemple illustre l'utilisation et l'effet des divers localisateurs et formateurs de date.
import numpy as np
import matplotlib.pyplot as plt
import matplotlib.ticker as ticker
from matplotlib.dates import (AutoDateLocator, YearLocator, MonthLocator,
                              DayLocator, WeekdayLocator, HourLocator,
                              MinuteLocator, SecondLocator, MicrosecondLocator,
                              RRuleLocator, rrulewrapper, MONTHLY,
                              MO, TU, WE, TH, FR, SA, SU, DateFormatter,
                              AutoDateFormatter, ConciseDateFormatter)

locators = [
    ('AutoDateLocator(maxticks=8)', '2003-02-01', '%Y-%m'),
    ('YearLocator(month=4)', '2003-02-01', '%Y-%m'),
    ('MonthLocator(bymonth=[4,8,12])', '2003-02-01', '%Y-%m'),
    ('DayLocator(interval=180)', '2003-02-01', '%Y-%m-%d'),
    ('WeekdayLocator(byweekday=SU, interval=4)', '2000-07-01', '%a %Y-%m-%d'),
    ('HourLocator(byhour=range(0,24,6))', '2000-02-04', '%H h'),
    ('MinuteLocator(interval=15)', '2000-02-01 02:00', '%H:%M'),
    ('SecondLocator(bysecond=(0,30))', '2000-02-01 00:02', '%H:%M:%S'),
    ('MicrosecondLocator(interval=1000)', '2000-02-01 00:00:00.005', '%S.%f'),
    ('RRuleLocator(rrulewrapper(freq=MONTHLY, \nbyweekday=(MO, TU, WE, TH,' +
     ' FR), bysetpos=-1))', '2000-07-01', '%Y-%m-%d')
]

formatters = [
    ('AutoDateFormatter(ax.xaxis.get_major_locator())'),
    ('ConciseDateFormatter(ax.xaxis.get_major_locator())'),
    ('DateFormatter("%b %Y")')
]


def plot_axis(ax, locator=None, xmax='2002-02-01', fmt=None, formatter=None):
    """Set up common parameters for the Axes in the example."""
    ax.spines.right.set_visible(False)
    ax.spines.left.set_visible(False)
    ax.spines.top.set_visible(False)
    ax.yaxis.set_major_locator(ticker.NullLocator())
    ax.tick_params(which='major', width=1.00, length=5)
    ax.tick_params(which='minor', width=0.75, length=2.5)
    ax.set_xlim(np.datetime64('2000-02-01'), np.datetime64(xmax))
    if locator:
        ax.xaxis.set_major_locator(eval(locator))
        ax.xaxis.set_major_formatter(DateFormatter(fmt))
    else:
        ax.xaxis.set_major_formatter(eval(formatter))
    ax.text(0.0, 0.2, locator or formatter, transform=ax.transAxes,
            fontsize=14, fontname='Monospace', color='tab:blue')


fig, ax = plt.subplots(len(locators), 1, figsize=(8, len(locators) * .8),
                       layout='constrained')
fig.suptitle('Date Locators')
for i, loc in enumerate(locators):
    plot_axis(ax[i], *loc)

fig, ax = plt.subplots(len(formatters), 1, figsize=(8, len(formatters) * .8),
                       layout='constrained')
fig.suptitle('Date Formatters')
for i, fmt in enumerate(formatters):
    plot_axis(ax[i], formatter=fmt)
Références
L'utilisation des fonctions, méthodes, classes et modules suivants est illustrée dans cet exemple :
Durée totale d'exécution du script : (0 minutes 2,097 secondes)