Noter
Cliquez ici pour télécharger l'exemple de code complet
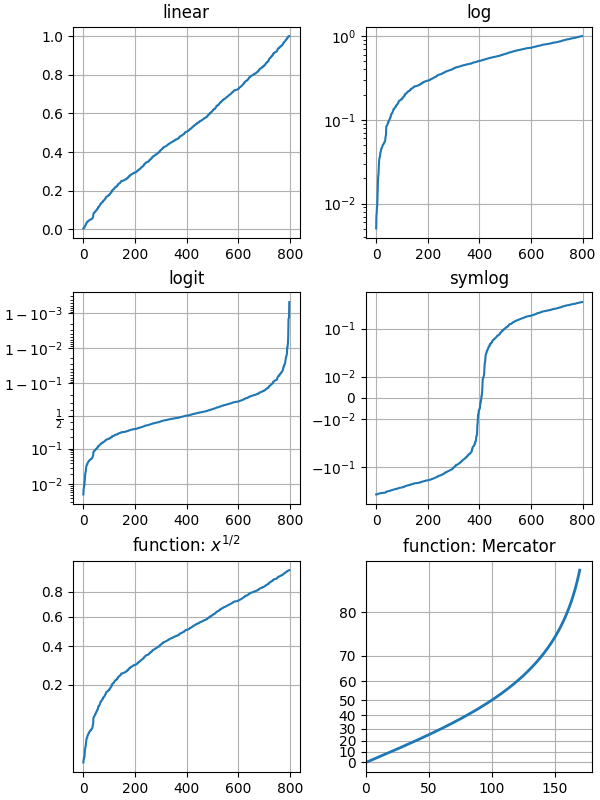
Échelles #
Illustrer les transformations d'échelle appliquées aux axes, par exemple log, symlog, logit.
Les deux derniers exemples sont des exemples d'utilisation de l' 'function'échelle en fournissant des fonctions directes et inverses pour la transformation d'échelle.
import numpy as np
import matplotlib.pyplot as plt
from matplotlib.ticker import NullFormatter, FixedLocator

# Fixing random state for reproducibility
np.random.seed(19680801)

# make up some data in the interval ]0, 1[
y = np.random.normal(loc=0.5, scale=0.4, size=1000)
y = y[(y > 0) & (y < 1)]
y.sort()
x = np.arange(len(y))

# plot with various axes scales
fig, axs = plt.subplots(3, 2, figsize=(6, 8),
                        constrained_layout=True)

# linear
ax = axs[0, 0]
ax.plot(x, y)
ax.set_yscale('linear')
ax.set_title('linear')
ax.grid(True)


# log
ax = axs[0, 1]
ax.plot(x, y)
ax.set_yscale('log')
ax.set_title('log')
ax.grid(True)


# symmetric log
ax = axs[1, 1]
ax.plot(x, y - y.mean())
ax.set_yscale('symlog', linthresh=0.02)
ax.set_title('symlog')
ax.grid(True)

# logit
ax = axs[1, 0]
ax.plot(x, y)
ax.set_yscale('logit')
ax.set_title('logit')
ax.grid(True)


# Function x**(1/2)
def forward(x):
    return x**(1/2)


def inverse(x):
    return x**2


ax = axs[2, 0]
ax.plot(x, y)
ax.set_yscale('function', functions=(forward, inverse))
ax.set_title('function: $x^{1/2}$')
ax.grid(True)
ax.yaxis.set_major_locator(FixedLocator(np.arange(0, 1, 0.2)**2))
ax.yaxis.set_major_locator(FixedLocator(np.arange(0, 1, 0.2)))


# Function Mercator transform
def forward(a):
    a = np.deg2rad(a)
    return np.rad2deg(np.log(np.abs(np.tan(a) + 1.0 / np.cos(a))))


def inverse(a):
    a = np.deg2rad(a)
    return np.rad2deg(np.arctan(np.sinh(a)))

ax = axs[2, 1]

t = np.arange(0, 170.0, 0.1)
s = t / 2.

ax.plot(t, s, '-', lw=2)

ax.set_yscale('function', functions=(forward, inverse))
ax.set_title('function: Mercator')
ax.grid(True)
ax.set_xlim([0, 180])
ax.yaxis.set_minor_formatter(NullFormatter())
ax.yaxis.set_major_locator(FixedLocator(np.arange(0, 90, 10)))

plt.show()
Références
L'utilisation des fonctions, méthodes, classes et modules suivants est illustrée dans cet exemple :
Durée totale d'exécution du script : (0 minutes 1,848 secondes)