Noter
Cliquez ici pour télécharger l'exemple de code complet
Utilisation de span_where #
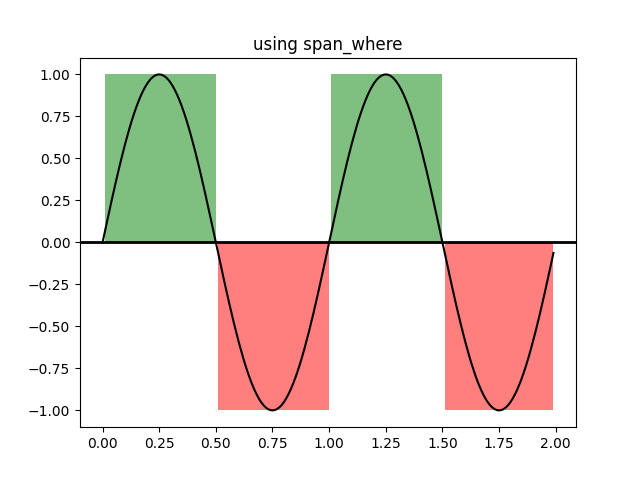
Illustrez certaines fonctions d'assistance pour les régions d'ombrage où un masque logique est vrai.
Voir matplotlib.collections.BrokenBarHCollection.span_where.
import numpy as np
import matplotlib.pyplot as plt
import matplotlib.collections as collections


t = np.arange(0.0, 2, 0.01)
s1 = np.sin(2*np.pi*t)
s2 = 1.2*np.sin(4*np.pi*t)


fig, ax = plt.subplots()
ax.set_title('using span_where')
ax.plot(t, s1, color='black')
ax.axhline(0, color='black', lw=2)

collection = collections.BrokenBarHCollection.span_where(
    t, ymin=0, ymax=1, where=s1 > 0, facecolor='green', alpha=0.5)
ax.add_collection(collection)

collection = collections.BrokenBarHCollection.span_where(
    t, ymin=-1, ymax=0, where=s1 < 0, facecolor='red', alpha=0.5)
ax.add_collection(collection)


plt.show()

Références
L'utilisation des fonctions, méthodes, classes et modules suivants est illustrée dans cet exemple :