Noter
Cliquez ici pour télécharger l'exemple de code complet
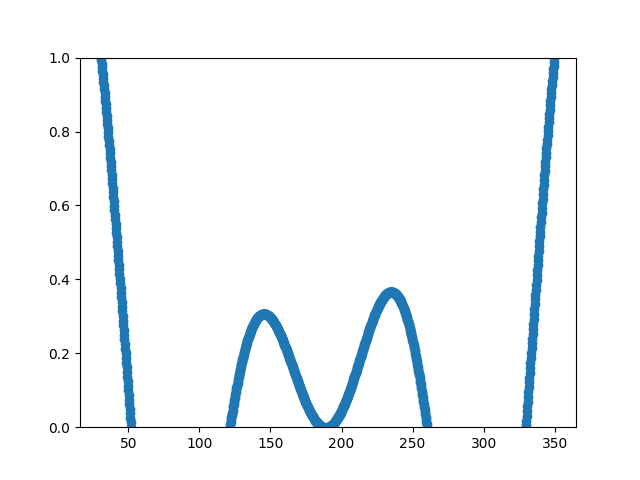
Données de rééchantillonnage #
Le sous-échantillonnage réduit la fréquence d'échantillonnage ou la taille d'échantillon d'un signal. Dans ce didacticiel, le signal est sous-échantillonné lorsque le tracé est ajusté par glissement et zoom.
Noter
Cet exemple exerce les capacités interactives de Matplotlib, et cela n'apparaîtra pas dans la documentation statique. Veuillez exécuter ce code sur votre machine pour voir l'interactivité.
Vous pouvez copier et coller des parties individuelles ou télécharger l'exemple complet en utilisant le lien au bas de la page.
import numpy as np
import matplotlib.pyplot as plt


# A class that will downsample the data and recompute when zoomed.
class DataDisplayDownsampler:
    def __init__(self, xdata, ydata):
        self.origYData = ydata
        self.origXData = xdata
        self.max_points = 50
        self.delta = xdata[-1] - xdata[0]

    def downsample(self, xstart, xend):
        # get the points in the view range
        mask = (self.origXData > xstart) & (self.origXData < xend)
        # dilate the mask by one to catch the points just outside
        # of the view range to not truncate the line
        mask = np.convolve([1, 1, 1], mask, mode='same').astype(bool)
        # sort out how many points to drop
        ratio = max(np.sum(mask) // self.max_points, 1)

        # mask data
        xdata = self.origXData[mask]
        ydata = self.origYData[mask]

        # downsample data
        xdata = xdata[::ratio]
        ydata = ydata[::ratio]

        print("using {} of {} visible points".format(len(ydata), np.sum(mask)))

        return xdata, ydata

    def update(self, ax):
        # Update the line
        lims = ax.viewLim
        if abs(lims.width - self.delta) > 1e-8:
            self.delta = lims.width
            xstart, xend = lims.intervalx
            self.line.set_data(*self.downsample(xstart, xend))
            ax.figure.canvas.draw_idle()


# Create a signal
xdata = np.linspace(16, 365, (365-16)*4)
ydata = np.sin(2*np.pi*xdata/153) + np.cos(2*np.pi*xdata/127)

d = DataDisplayDownsampler(xdata, ydata)

fig, ax = plt.subplots()

# Hook up the line
d.line, = ax.plot(xdata, ydata, 'o-')
ax.set_autoscale_on(False)  # Otherwise, infinite loop

# Connect for changing the view limits
ax.callbacks.connect('xlim_changed', d.update)
ax.set_xlim(16, 365)
plt.show()