Noter
Cliquez ici pour télécharger l'exemple de code complet
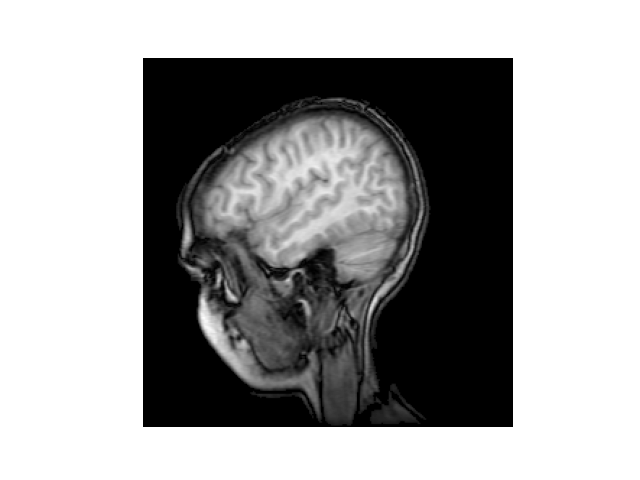
IRM #
Cet exemple illustre comment lire une image (d'un IRM) dans un tableau NumPy et l'afficher en niveaux de gris à l'aide de imshow.
import matplotlib.pyplot as plt
import matplotlib.cbook as cbook
import numpy as np


# Data are 256x256 16 bit integers.
with cbook.get_sample_data('s1045.ima.gz') as dfile:
    im = np.frombuffer(dfile.read(), np.uint16).reshape((256, 256))

fig, ax = plt.subplots(num="MRI_demo")
ax.imshow(im, cmap="gray")
ax.axis('off')

plt.show()