Noter
Cliquez ici pour télécharger l'exemple de code complet
Navigateur de données #
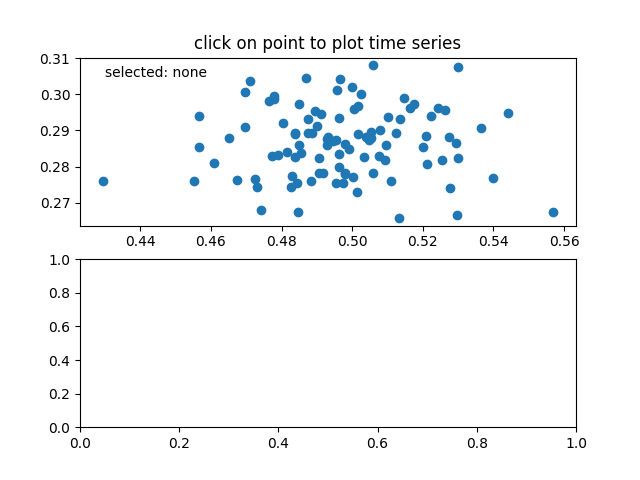
Connexion de données entre plusieurs toiles.
Cet exemple explique comment interagir avec des données avec plusieurs canevas. Cela vous permet de sélectionner et de mettre en surbrillance un point sur un axe et de générer les données de ce point sur l'autre axe.
Noter
Cet exemple exerce les capacités interactives de Matplotlib, et cela n'apparaîtra pas dans la documentation statique. Veuillez exécuter ce code sur votre machine pour voir l'interactivité.
Vous pouvez copier et coller des parties individuelles ou télécharger l'exemple complet en utilisant le lien au bas de la page.

import numpy as np


class PointBrowser:
    """
    Click on a point to select and highlight it -- the data that
    generated the point will be shown in the lower axes.  Use the 'n'
    and 'p' keys to browse through the next and previous points
    """

    def __init__(self):
        self.lastind = 0

        self.text = ax.text(0.05, 0.95, 'selected: none',
                            transform=ax.transAxes, va='top')
        self.selected, = ax.plot([xs[0]], [ys[0]], 'o', ms=12, alpha=0.4,
                                 color='yellow', visible=False)

    def on_press(self, event):
        if self.lastind is None:
            return
        if event.key not in ('n', 'p'):
            return
        if event.key == 'n':
            inc = 1
        else:
            inc = -1

        self.lastind += inc
        self.lastind = np.clip(self.lastind, 0, len(xs) - 1)
        self.update()

    def on_pick(self, event):

        if event.artist != line:
            return True

        N = len(event.ind)
        if not N:
            return True

        # the click locations
        x = event.mouseevent.xdata
        y = event.mouseevent.ydata

        distances = np.hypot(x - xs[event.ind], y - ys[event.ind])
        indmin = distances.argmin()
        dataind = event.ind[indmin]

        self.lastind = dataind
        self.update()

    def update(self):
        if self.lastind is None:
            return

        dataind = self.lastind

        ax2.clear()
        ax2.plot(X[dataind])

        ax2.text(0.05, 0.9, f'mu={xs[dataind]:1.3f}\nsigma={ys[dataind]:1.3f}',
                 transform=ax2.transAxes, va='top')
        ax2.set_ylim(-0.5, 1.5)
        self.selected.set_visible(True)
        self.selected.set_data(xs[dataind], ys[dataind])

        self.text.set_text('selected: %d' % dataind)
        fig.canvas.draw()


if __name__ == '__main__':
    import matplotlib.pyplot as plt
    # Fixing random state for reproducibility
    np.random.seed(19680801)

    X = np.random.rand(100, 200)
    xs = np.mean(X, axis=1)
    ys = np.std(X, axis=1)

    fig, (ax, ax2) = plt.subplots(2, 1)
    ax.set_title('click on point to plot time series')
    line, = ax.plot(xs, ys, 'o', picker=True, pickradius=5)

    browser = PointBrowser()

    fig.canvas.mpl_connect('pick_event', browser.on_pick)
    fig.canvas.mpl_connect('key_press_event', browser.on_press)

    plt.show()