Noter
Cliquez ici pour télécharger l'exemple de code complet
Redimensionner les axes avec une mise en page serrée #
tight_layouttente de redimensionner les sous-parcelles dans une figure afin qu'il n'y ait pas de chevauchement entre les objets d'axes et les étiquettes sur les axes.
Voir Guide de mise en page serrée pour plus de détails et Guide de mise en page contrainte pour une alternative.
import matplotlib.pyplot as plt
import itertools
import warnings


fontsizes = itertools.cycle([8, 16, 24, 32])


def example_plot(ax):
    ax.plot([1, 2])
    ax.set_xlabel('x-label', fontsize=next(fontsizes))
    ax.set_ylabel('y-label', fontsize=next(fontsizes))
    ax.set_title('Title', fontsize=next(fontsizes))
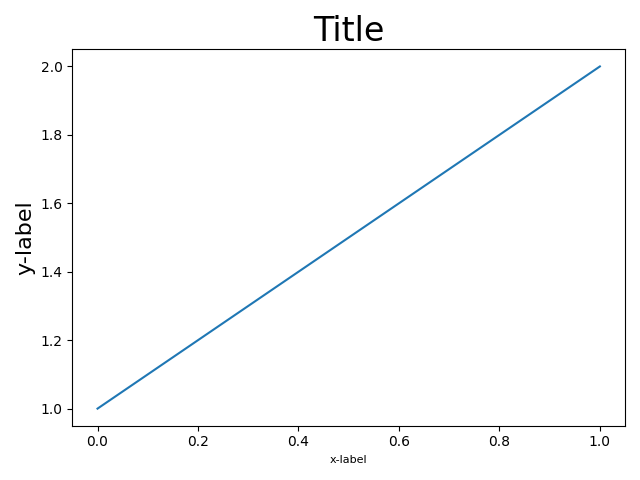
fig, ax = plt.subplots()
example_plot(ax)
fig.tight_layout()
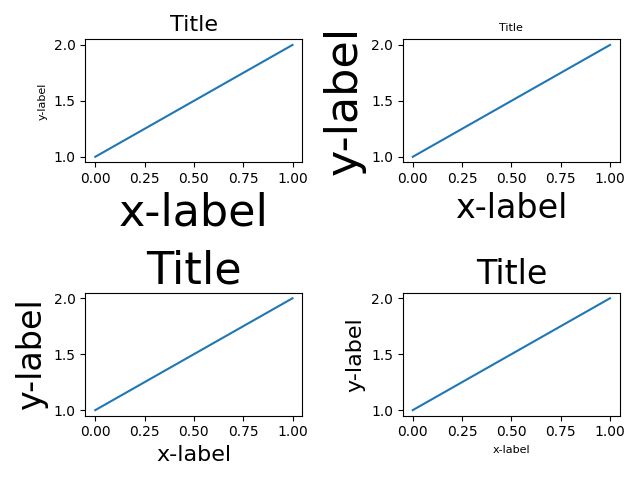
fig, ((ax1, ax2), (ax3, ax4)) = plt.subplots(nrows=2, ncols=2)
example_plot(ax1)
example_plot(ax2)
example_plot(ax3)
example_plot(ax4)
fig.tight_layout()
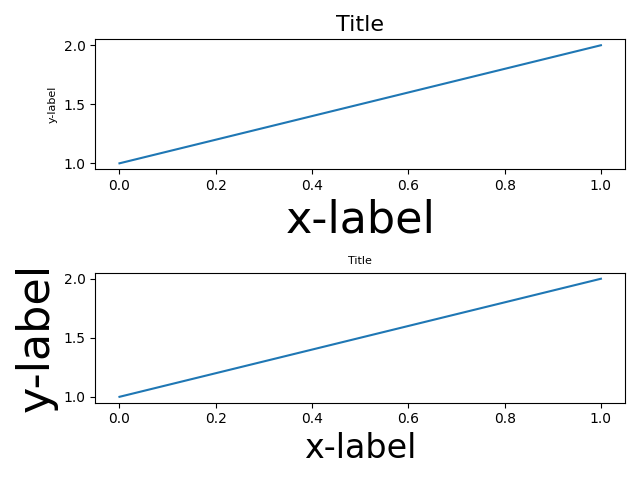
fig, (ax1, ax2) = plt.subplots(nrows=2, ncols=1)
example_plot(ax1)
example_plot(ax2)
fig.tight_layout()
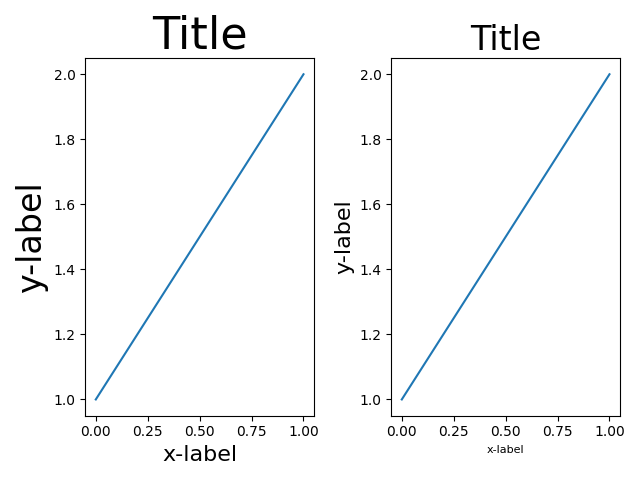
fig, (ax1, ax2) = plt.subplots(nrows=1, ncols=2)
example_plot(ax1)
example_plot(ax2)
fig.tight_layout()
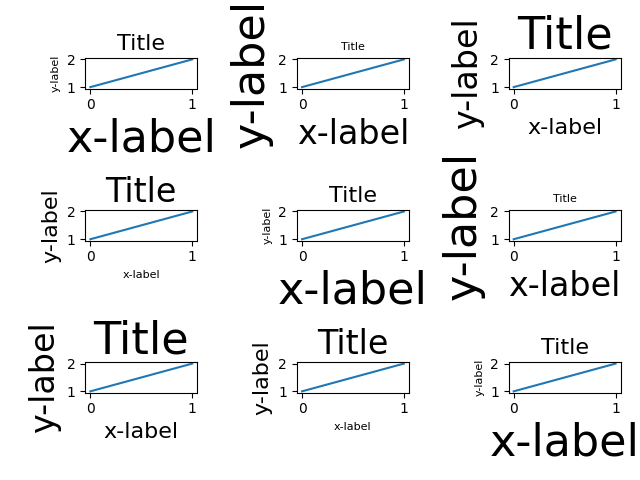
fig, axs = plt.subplots(nrows=3, ncols=3)
for ax in axs.flat:
    example_plot(ax)
fig.tight_layout()
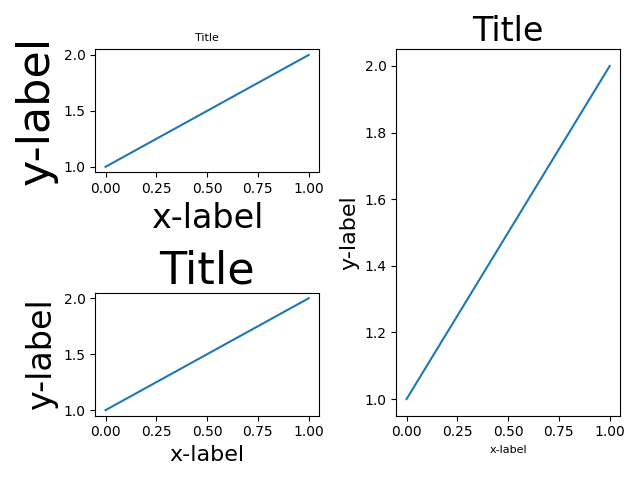
plt.figure()
ax1 = plt.subplot(221)
ax2 = plt.subplot(223)
ax3 = plt.subplot(122)
example_plot(ax1)
example_plot(ax2)
example_plot(ax3)
plt.tight_layout()
plt.figure()
ax1 = plt.subplot2grid((3, 3), (0, 0))
ax2 = plt.subplot2grid((3, 3), (0, 1), colspan=2)
ax3 = plt.subplot2grid((3, 3), (1, 0), colspan=2, rowspan=2)
ax4 = plt.subplot2grid((3, 3), (1, 2), rowspan=2)
example_plot(ax1)
example_plot(ax2)
example_plot(ax3)
example_plot(ax4)
plt.tight_layout()
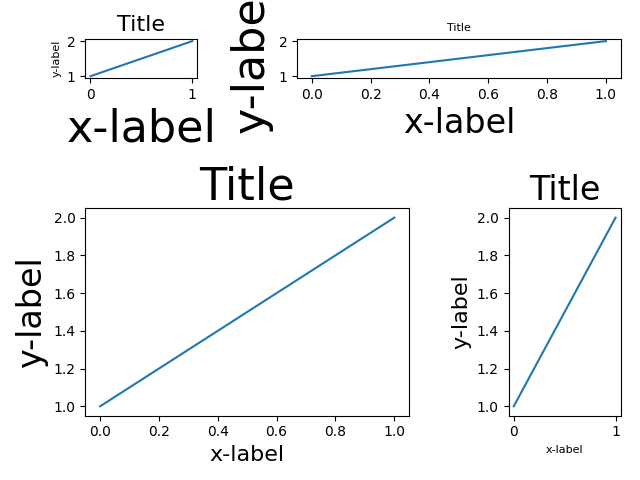
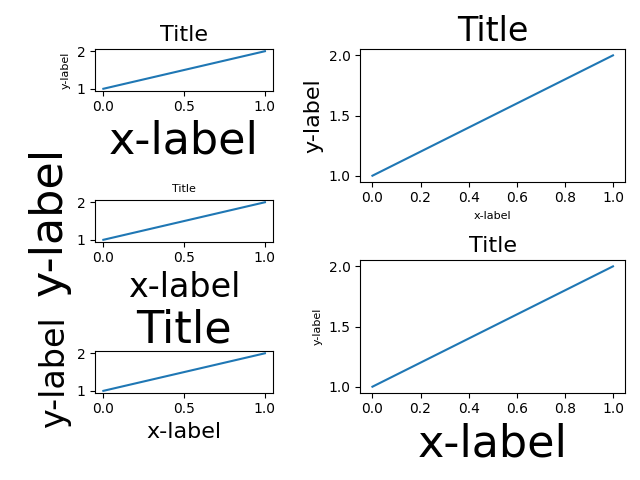
fig = plt.figure()

gs1 = fig.add_gridspec(3, 1)
ax1 = fig.add_subplot(gs1[0])
ax2 = fig.add_subplot(gs1[1])
ax3 = fig.add_subplot(gs1[2])
example_plot(ax1)
example_plot(ax2)
example_plot(ax3)
gs1.tight_layout(fig, rect=[None, None, 0.45, None])

gs2 = fig.add_gridspec(2, 1)
ax4 = fig.add_subplot(gs2[0])
ax5 = fig.add_subplot(gs2[1])
example_plot(ax4)
example_plot(ax5)
with warnings.catch_warnings():
    # gs2.tight_layout cannot handle the subplots from the first gridspec
    # (gs1), so it will raise a warning. We are going to match the gridspecs
    # manually so we can filter the warning away.
    warnings.simplefilter("ignore", UserWarning)
    gs2.tight_layout(fig, rect=[0.45, None, None, None])

# now match the top and bottom of two gridspecs.
top = min(gs1.top, gs2.top)
bottom = max(gs1.bottom, gs2.bottom)

gs1.update(top=top, bottom=bottom)
gs2.update(top=top, bottom=bottom)

plt.show()
Références
L'utilisation des fonctions, méthodes, classes et modules suivants est illustrée dans cet exemple :
Durée totale d'exécution du script : (0 minutes 4,973 secondes)