Noter
Cliquez ici pour télécharger l'exemple de code complet
Stackplots et streamgraphs #
Stackplots #
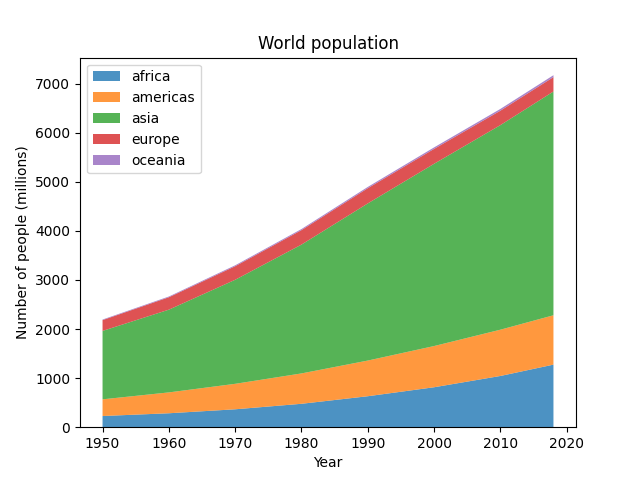
Les Stackplots dessinent plusieurs ensembles de données sous forme de zones empilées verticalement. Ceci est utile lorsque les valeurs de données individuelles et en plus leur valeur cumulée sont intéressantes.
import numpy as np
import matplotlib.pyplot as plt

# data from United Nations World Population Prospects (Revision 2019)
# https://population.un.org/wpp/, license: CC BY 3.0 IGO
year = [1950, 1960, 1970, 1980, 1990, 2000, 2010, 2018]
population_by_continent = {
    'africa': [228, 284, 365, 477, 631, 814, 1044, 1275],
    'americas': [340, 425, 519, 619, 727, 840, 943, 1006],
    'asia': [1394, 1686, 2120, 2625, 3202, 3714, 4169, 4560],
    'europe': [220, 253, 276, 295, 310, 303, 294, 293],
    'oceania': [12, 15, 19, 22, 26, 31, 36, 39],
}

fig, ax = plt.subplots()
ax.stackplot(year, population_by_continent.values(),
             labels=population_by_continent.keys(), alpha=0.8)
ax.legend(loc='upper left')
ax.set_title('World population')
ax.set_xlabel('Year')
ax.set_ylabel('Number of people (millions)')

plt.show()

Streamgraphs #
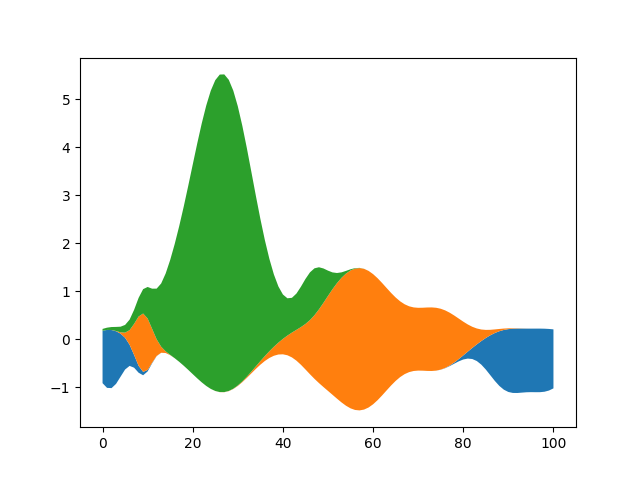
À l'aide du paramètre de ligne de base , vous pouvez transformer un graphique en aires empilées ordinaire avec la ligne de base 0 en un graphique de flux.
# Fixing random state for reproducibility
np.random.seed(19680801)


def gaussian_mixture(x, n=5):
    """Return a random mixture of *n* Gaussians, evaluated at positions *x*."""
    def add_random_gaussian(a):
        amplitude = 1 / (.1 + np.random.random())
        dx = x[-1] - x[0]
        x0 = (2 * np.random.random() - .5) * dx
        z = 10 / (.1 + np.random.random()) / dx
        a += amplitude * np.exp(-(z * (x - x0))**2)
    a = np.zeros_like(x)
    for j in range(n):
        add_random_gaussian(a)
    return a


x = np.linspace(0, 100, 101)
ys = [gaussian_mixture(x) for _ in range(3)]

fig, ax = plt.subplots()
ax.stackplot(x, ys, baseline='wiggle')
plt.show()
