Noter
Cliquez ici pour télécharger l'exemple de code complet
Composer des légendes personnalisées #
Composer des légendes personnalisées pièce par pièce.
Noter
Pour plus d'informations sur la création et la personnalisation des légendes, consultez les pages suivantes :
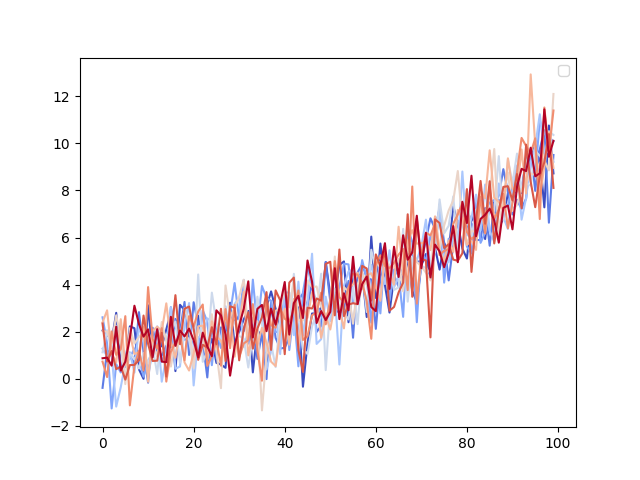
Parfois, vous ne voulez pas d'une légende explicitement liée aux données que vous avez tracées. Par exemple, supposons que vous ayez tracé 10 lignes, mais que vous ne souhaitiez pas qu'un élément de légende apparaisse pour chacune d'entre elles. Si vous tracez simplement les lignes et appelez ax.legend(), vous obtiendrez ce qui suit :
import matplotlib as mpl
from matplotlib import cycler
import matplotlib.pyplot as plt
import numpy as np

# Fixing random state for reproducibility
np.random.seed(19680801)

N = 10
data = (np.geomspace(1, 10, 100) + np.random.randn(N, 100)).T
cmap = plt.cm.coolwarm
mpl.rcParams['axes.prop_cycle'] = cycler(color=cmap(np.linspace(0, 1, N)))

fig, ax = plt.subplots()
lines = ax.plot(data)
ax.legend()

No artists with labels found to put in legend.  Note that artists whose label start with an underscore are ignored when legend() is called with no argument.

<matplotlib.legend.Legend object at 0x7f2cf9d80c40>
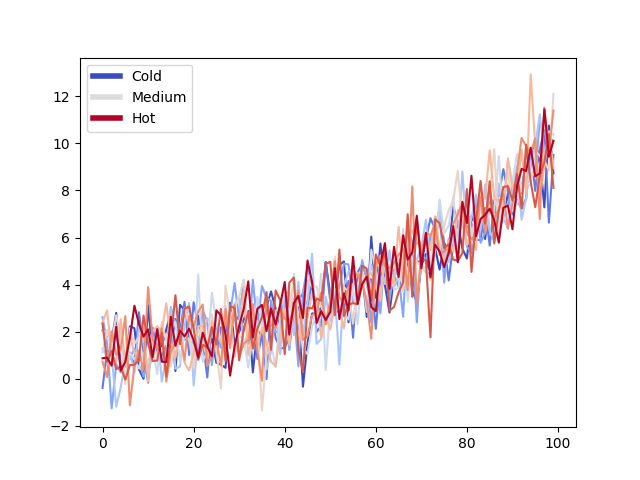
Notez qu'aucune entrée de légende n'a été créée. Dans ce cas, nous pouvons composer une légende à l'aide d'objets Matplotlib qui ne sont pas explicitement liés aux données tracées. Par exemple:
from matplotlib.lines import Line2D
custom_lines = [Line2D([0], [0], color=cmap(0.), lw=4),
                Line2D([0], [0], color=cmap(.5), lw=4),
                Line2D([0], [0], color=cmap(1.), lw=4)]

fig, ax = plt.subplots()
lines = ax.plot(data)
ax.legend(custom_lines, ['Cold', 'Medium', 'Hot'])

<matplotlib.legend.Legend object at 0x7f2cfaadfac0>
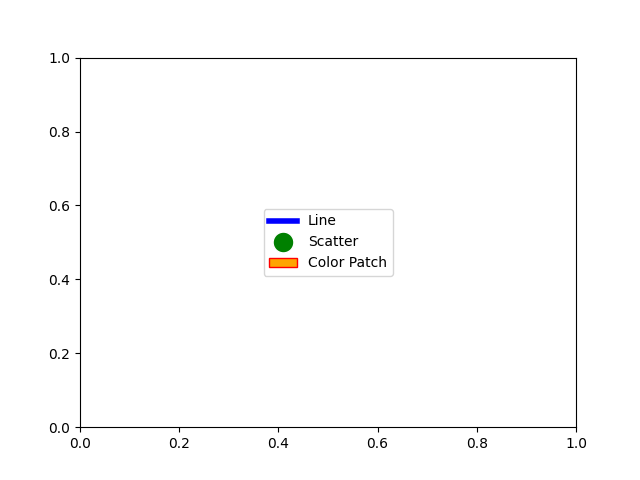
Il existe de nombreux autres objets Matplotlib qui peuvent être utilisés de cette manière. Dans le code ci-dessous, nous avons répertorié quelques-uns des plus courants.
from matplotlib.patches import Patch
from matplotlib.lines import Line2D

legend_elements = [Line2D([0], [0], color='b', lw=4, label='Line'),
                   Line2D([0], [0], marker='o', color='w', label='Scatter',
                          markerfacecolor='g', markersize=15),
                   Patch(facecolor='orange', edgecolor='r',
                         label='Color Patch')]

# Create the figure
fig, ax = plt.subplots()
ax.legend(handles=legend_elements, loc='center')

plt.show()

Durée totale d'exécution du script : ( 0 minutes 1.610 secondes)