Noter
Cliquez ici pour télécharger l'exemple de code complet
Démonstration du localisateur d'encart #
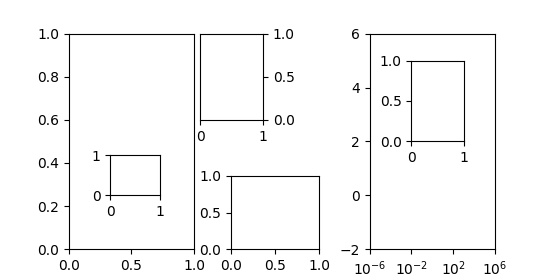
Le permet inset_locatorde inset_axesplacer facilement des encarts dans les coins des axes en spécifiant une largeur et une hauteur et éventuellement un emplacement (loc) qui accepte les emplacements comme codes, similaire à legend. Par défaut, l'encart est décalé de quelques points par rapport aux axes, contrôlés via le paramètre borderpad .
import matplotlib.pyplot as plt
from mpl_toolkits.axes_grid1.inset_locator import inset_axes


fig, (ax, ax2) = plt.subplots(1, 2, figsize=[5.5, 2.8])

# Create inset of width 1.3 inches and height 0.9 inches
# at the default upper right location
axins = inset_axes(ax, width=1.3, height=0.9)

# Create inset of width 30% and height 40% of the parent axes' bounding box
# at the lower left corner (loc=3)
axins2 = inset_axes(ax, width="30%", height="40%", loc=3)

# Create inset of mixed specifications in the second subplot;
# width is 30% of parent axes' bounding box and
# height is 1 inch at the upper left corner (loc=2)
axins3 = inset_axes(ax2, width="30%", height=1., loc=2)

# Create an inset in the lower right corner (loc=4) with borderpad=1, i.e.
# 10 points padding (as 10pt is the default fontsize) to the parent axes
axins4 = inset_axes(ax2, width="20%", height="20%", loc=4, borderpad=1)

# Turn ticklabels of insets off
for axi in [axins, axins2, axins3, axins4]:
    axi.tick_params(labelleft=False, labelbottom=False)

plt.show()
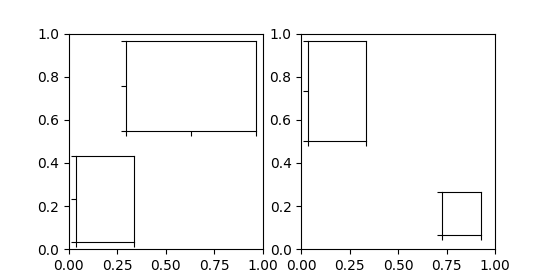
Les paramètres bbox_to_anchor et bbox_transform peuvent être utilisés pour un contrôle plus fin de la position et de la taille de l'encart ou même pour positionner l'encart à des positions complètement arbitraires. Le bbox_to_anchor définit la boîte englobante en coordonnées selon le bbox_transform .
fig = plt.figure(figsize=[5.5, 2.8])
ax = fig.add_subplot(121)

# We use the axes transform as bbox_transform. Therefore the bounding box
# needs to be specified in axes coordinates ((0, 0) is the lower left corner
# of the axes, (1, 1) is the upper right corner).
# The bounding box (.2, .4, .6, .5) starts at (.2, .4) and ranges to (.8, .9)
# in those coordinates.
# Inside of this bounding box an inset of half the bounding box' width and
# three quarters of the bounding box' height is created. The lower left corner
# of the inset is aligned to the lower left corner of the bounding box (loc=3).
# The inset is then offset by the default 0.5 in units of the font size.

axins = inset_axes(ax, width="50%", height="75%",
                   bbox_to_anchor=(.2, .4, .6, .5),
                   bbox_transform=ax.transAxes, loc=3)

# For visualization purposes we mark the bounding box by a rectangle
ax.add_patch(plt.Rectangle((.2, .4), .6, .5, ls="--", ec="c", fc="none",
                           transform=ax.transAxes))

# We set the axis limits to something other than the default, in order to not
# distract from the fact that axes coordinates are used here.
ax.set(xlim=(0, 10), ylim=(0, 10))


# Note how the two following insets are created at the same positions, one by
# use of the default parent axes' bbox and the other via a bbox in axes
# coordinates and the respective transform.
ax2 = fig.add_subplot(222)
axins2 = inset_axes(ax2, width="30%", height="50%")

ax3 = fig.add_subplot(224)
axins3 = inset_axes(ax3, width="100%", height="100%",
                    bbox_to_anchor=(.7, .5, .3, .5),
                    bbox_transform=ax3.transAxes)

# For visualization purposes we mark the bounding box by a rectangle
ax2.add_patch(plt.Rectangle((0, 0), 1, 1, ls="--", lw=2, ec="c", fc="none"))
ax3.add_patch(plt.Rectangle((.7, .5), .3, .5, ls="--", lw=2,
                            ec="c", fc="none"))

# Turn ticklabels off
for axi in [axins2, axins3, ax2, ax3]:
    axi.tick_params(labelleft=False, labelbottom=False)

plt.show()
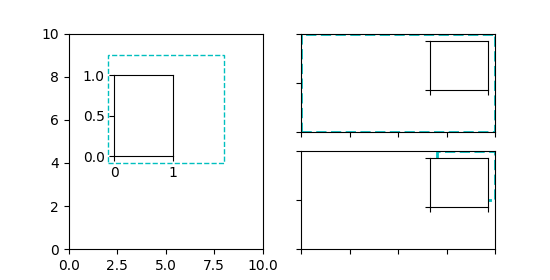
Dans ce qui précède, la transformation des axes avec des boîtes englobantes à 4 tuples a été utilisée car il est généralement utile de spécifier un encart par rapport aux axes auxquels il est un encart. Cependant, d'autres cas d'utilisation sont également possibles. L'exemple suivant en examine quelques-uns.
fig = plt.figure(figsize=[5.5, 2.8])
ax = fig.add_subplot(131)

# Create an inset outside the axes
axins = inset_axes(ax, width="100%", height="100%",
                   bbox_to_anchor=(1.05, .6, .5, .4),
                   bbox_transform=ax.transAxes, loc=2, borderpad=0)
axins.tick_params(left=False, right=True, labelleft=False, labelright=True)

# Create an inset with a 2-tuple bounding box. Note that this creates a
# bbox without extent. This hence only makes sense when specifying
# width and height in absolute units (inches).
axins2 = inset_axes(ax, width=0.5, height=0.4,
                    bbox_to_anchor=(0.33, 0.25),
                    bbox_transform=ax.transAxes, loc=3, borderpad=0)


ax2 = fig.add_subplot(133)
ax2.set_xscale("log")
ax2.set(xlim=(1e-6, 1e6), ylim=(-2, 6))

# Create inset in data coordinates using ax.transData as transform
axins3 = inset_axes(ax2, width="100%", height="100%",
                    bbox_to_anchor=(1e-2, 2, 1e3, 3),
                    bbox_transform=ax2.transData, loc=2, borderpad=0)

# Create an inset horizontally centered in figure coordinates and vertically
# bound to line up with the axes.
from matplotlib.transforms import blended_transform_factory  # noqa
transform = blended_transform_factory(fig.transFigure, ax2.transAxes)
axins4 = inset_axes(ax2, width="16%", height="34%",
                    bbox_to_anchor=(0, 0, 1, 1),
                    bbox_transform=transform, loc=8, borderpad=0)

plt.show()