Noter
Cliquez ici pour télécharger l'exemple de code complet
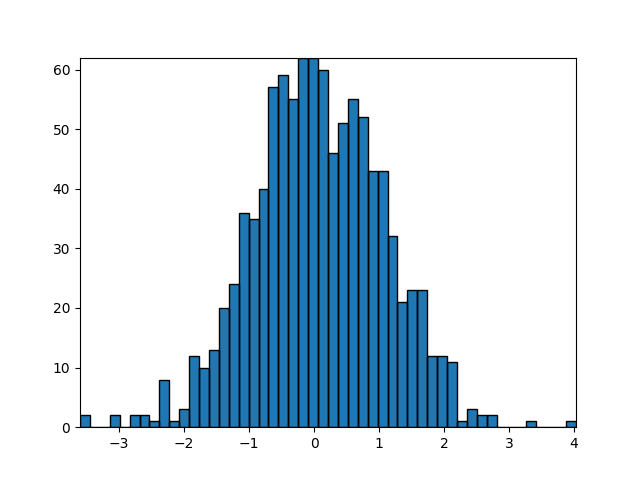
Construire des histogrammes en utilisant Rectangles et PolyCollections #
Utilisation d'un patch de chemin pour dessiner des rectangles. La technique d'utilisation de nombreuses instances Rectangle, ou la méthode plus rapide d'utilisation de PolyCollections, a été implémentée avant que nous ayons des chemins appropriés avec moveto/lineto, closepoly, etc. dans mpl. Maintenant que nous les avons, nous pouvons dessiner plus efficacement des collections d'objets de forme régulière avec des propriétés homogènes avec un PathCollection. Cet exemple crée un histogramme - il est plus difficile de configurer les tableaux de sommets au départ, mais cela devrait être beaucoup plus rapide pour un grand nombre d'objets.
import numpy as np
import matplotlib.pyplot as plt
import matplotlib.patches as patches
import matplotlib.path as path

fig, ax = plt.subplots()

# Fixing random state for reproducibility
np.random.seed(19680801)


# histogram our data with numpy

data = np.random.randn(1000)
n, bins = np.histogram(data, 50)

# get the corners of the rectangles for the histogram
left = bins[:-1]
right = bins[1:]
bottom = np.zeros(len(left))
top = bottom + n


# we need a (numrects x numsides x 2) numpy array for the path helper
# function to build a compound path
XY = np.array([[left, left, right, right], [bottom, top, top, bottom]]).T

# get the Path object
barpath = path.Path.make_compound_path_from_polys(XY)

# make a patch out of it
patch = patches.PathPatch(barpath)
ax.add_patch(patch)

# update the view limits
ax.set_xlim(left[0], right[-1])
ax.set_ylim(bottom.min(), top.max())

plt.show()
Il convient de noter qu'au lieu de créer un tableau tridimensionnel et d'utiliser make_compound_path_from_polys, nous pourrions également créer le chemin composé directement en utilisant des sommets et des codes, comme indiqué ci-dessous.
nrects = len(left)
nverts = nrects*(1+3+1)
verts = np.zeros((nverts, 2))
codes = np.ones(nverts, int) * path.Path.LINETO
codes[0::5] = path.Path.MOVETO
codes[4::5] = path.Path.CLOSEPOLY
verts[0::5, 0] = left
verts[0::5, 1] = bottom
verts[1::5, 0] = left
verts[1::5, 1] = top
verts[2::5, 0] = right
verts[2::5, 1] = top
verts[3::5, 0] = right
verts[3::5, 1] = bottom

barpath = path.Path(verts, codes)
Références
L'utilisation des fonctions, méthodes, classes et modules suivants est illustrée dans cet exemple :
Cet exemple montre une alternative à