Noter
Cliquez ici pour télécharger l'exemple de code complet
Axes Y multiples avec épines #
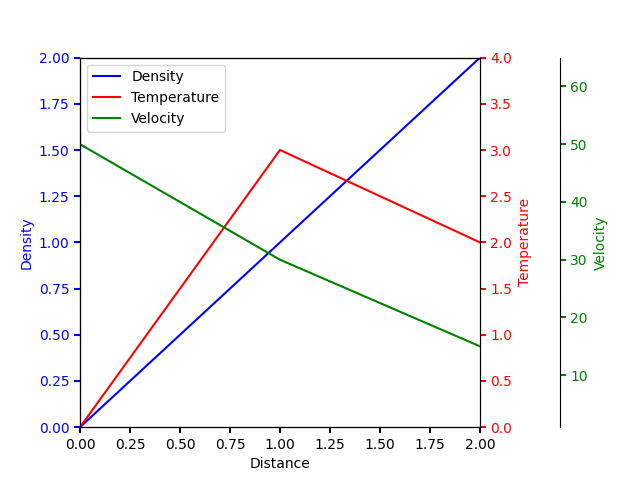
Créez plusieurs axes y avec un axe x partagé. Cela se fait en créant un twinxaxe, en rendant toutes les épines sauf celle de droite invisibles et en décalant sa position à l'aide de set_position.
Notez que cette approche utilise matplotlib.axes.Axeset leur
Spines. Une approche alternative pour les axes parasites est présentée dans les exemples de démonstration Parasite Axes et
Parasite axis demo .

import matplotlib.pyplot as plt


fig, ax = plt.subplots()
fig.subplots_adjust(right=0.75)

twin1 = ax.twinx()
twin2 = ax.twinx()

# Offset the right spine of twin2.  The ticks and label have already been
# placed on the right by twinx above.
twin2.spines.right.set_position(("axes", 1.2))

p1, = ax.plot([0, 1, 2], [0, 1, 2], "b-", label="Density")
p2, = twin1.plot([0, 1, 2], [0, 3, 2], "r-", label="Temperature")
p3, = twin2.plot([0, 1, 2], [50, 30, 15], "g-", label="Velocity")

ax.set_xlim(0, 2)
ax.set_ylim(0, 2)
twin1.set_ylim(0, 4)
twin2.set_ylim(1, 65)

ax.set_xlabel("Distance")
ax.set_ylabel("Density")
twin1.set_ylabel("Temperature")
twin2.set_ylabel("Velocity")

ax.yaxis.label.set_color(p1.get_color())
twin1.yaxis.label.set_color(p2.get_color())
twin2.yaxis.label.set_color(p3.get_color())

tkw = dict(size=4, width=1.5)
ax.tick_params(axis='y', colors=p1.get_color(), **tkw)
twin1.tick_params(axis='y', colors=p2.get_color(), **tkw)
twin2.tick_params(axis='y', colors=p3.get_color(), **tkw)
ax.tick_params(axis='x', **tkw)

ax.legend(handles=[p1, p2, p3])

plt.show()