Noter
Cliquez ici pour télécharger l'exemple de code complet
Texte arc-en-ciel #
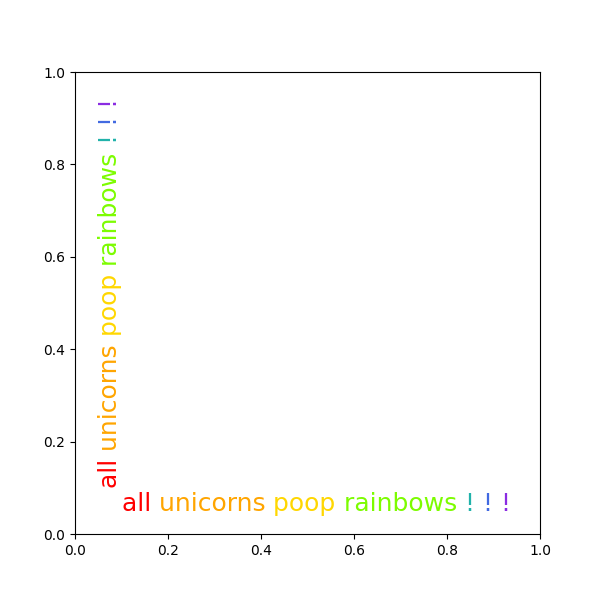
L'exemple montre comment enchaîner plusieurs objets texte.
Historique #
Sur la liste des utilisateurs de matplotlib en février 2012, Gökhan Sever a posé la question suivante :
Existe-t-il un moyen dans matplotlib de spécifier partiellement la couleur d'une chaîne?Exemple:plt.ylabel("Aujourd'hui il fait nuageux.")Comment puis-je afficher "aujourd'hui" en rouge, "est" en vert et "nuageux". aussi bleu?Merci.
La solution ci-dessous est modifiée à partir de la réponse originale de Paul Ivanov.

import matplotlib.pyplot as plt
from matplotlib.transforms import Affine2D, offset_copy


def rainbow_text(x, y, strings, colors, orientation='horizontal',
                 ax=None, **kwargs):
    """
    Take a list of *strings* and *colors* and place them next to each
    other, with text strings[i] being shown in colors[i].

    Parameters
    ----------
    x, y : float
        Text position in data coordinates.
    strings : list of str
        The strings to draw.
    colors : list of color
        The colors to use.
    orientation : {'horizontal', 'vertical'}
    ax : Axes, optional
        The Axes to draw into. If None, the current axes will be used.
    **kwargs
        All other keyword arguments are passed to plt.text(), so you can
        set the font size, family, etc.
    """
    if ax is None:
        ax = plt.gca()
    t = ax.transData
    fig = ax.figure
    canvas = fig.canvas

    assert orientation in ['horizontal', 'vertical']
    if orientation == 'vertical':
        kwargs.update(rotation=90, verticalalignment='bottom')

    for s, c in zip(strings, colors):
        text = ax.text(x, y, s + " ", color=c, transform=t, **kwargs)

        # Need to draw to update the text position.
        text.draw(canvas.get_renderer())
        ex = text.get_window_extent()
        # Convert window extent from pixels to inches
        # to avoid issues displaying at different dpi
        ex = fig.dpi_scale_trans.inverted().transform_bbox(ex)

        if orientation == 'horizontal':
            t = text.get_transform() + \
                offset_copy(Affine2D(), fig=fig, x=ex.width, y=0)
        else:
            t = text.get_transform() + \
                offset_copy(Affine2D(), fig=fig, x=0, y=ex.height)


words = "all unicorns poop rainbows ! ! !".split()
colors = ['red', 'orange', 'gold', 'lawngreen', 'lightseagreen', 'royalblue',
          'blueviolet']
plt.figure(figsize=(6, 6))
rainbow_text(0.1, 0.05, words, colors, size=18)
rainbow_text(0.05, 0.1, words, colors, orientation='vertical', size=18)

plt.show()