Noter
Cliquez ici pour télécharger l'exemple de code complet
Histogramme de dispersion (axes localisables) #
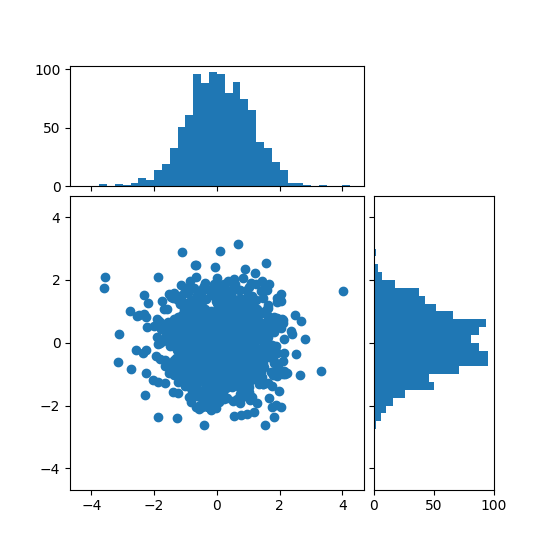
Affichez les distributions marginales d'un nuage de points sous forme d'histogrammes sur les côtés du graphique.
Pour un bon alignement des axes principaux avec les marginaux, les positions des axes sont définies par a Divider, produit via make_axes_locatable. Notez que l' DividerAPI permet de définir la taille des axes et des pads en pouces, ce qui est sa principale caractéristique.
Si l'on veut définir des tailles d'axes et des pads par rapport à la figure principale, voir l' exemple Nuage de points avec histogrammes .
import numpy as np
import matplotlib.pyplot as plt
from mpl_toolkits.axes_grid1 import make_axes_locatable

# Fixing random state for reproducibility
np.random.seed(19680801)

# the random data
x = np.random.randn(1000)
y = np.random.randn(1000)


fig, ax = plt.subplots(figsize=(5.5, 5.5))

# the scatter plot:
ax.scatter(x, y)

# Set aspect of the main axes.
ax.set_aspect(1.)

# create new axes on the right and on the top of the current axes
divider = make_axes_locatable(ax)
# below height and pad are in inches
ax_histx = divider.append_axes("top", 1.2, pad=0.1, sharex=ax)
ax_histy = divider.append_axes("right", 1.2, pad=0.1, sharey=ax)

# make some labels invisible
ax_histx.xaxis.set_tick_params(labelbottom=False)
ax_histy.yaxis.set_tick_params(labelleft=False)

# now determine nice limits by hand:
binwidth = 0.25
xymax = max(np.max(np.abs(x)), np.max(np.abs(y)))
lim = (int(xymax/binwidth) + 1)*binwidth

bins = np.arange(-lim, lim + binwidth, binwidth)
ax_histx.hist(x, bins=bins)
ax_histy.hist(y, bins=bins, orientation='horizontal')

# the xaxis of ax_histx and yaxis of ax_histy are shared with ax,
# thus there is no need to manually adjust the xlim and ylim of these
# axis.

ax_histx.set_yticks([0, 50, 100])
ax_histy.set_xticks([0, 50, 100])

plt.show()

Références
L'utilisation des fonctions, méthodes, classes et modules suivants est illustrée dans cet exemple :