Noter
Cliquez ici pour télécharger l'exemple de code complet
Projections géographiques #
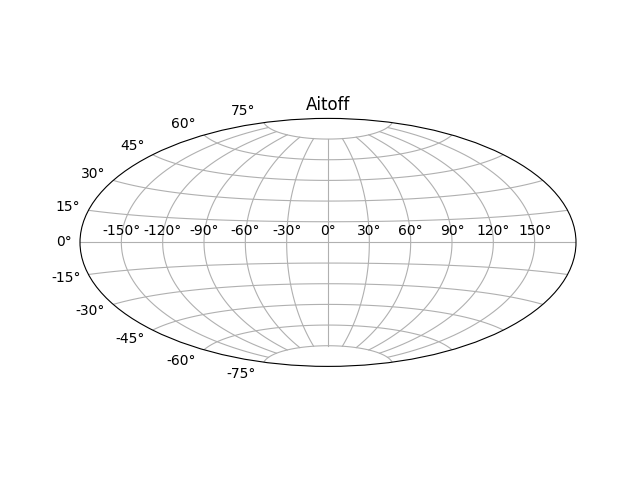
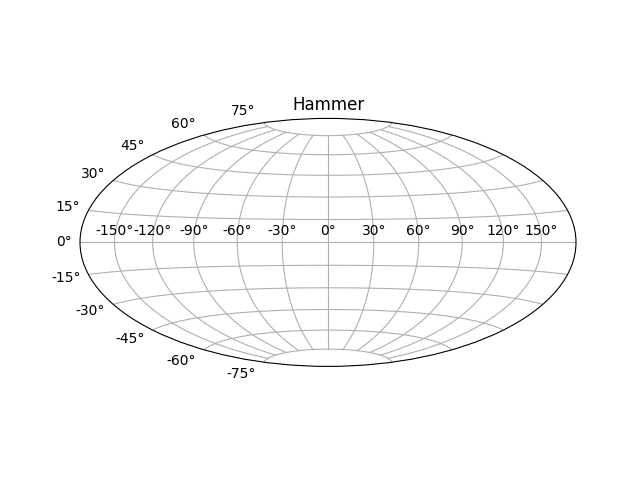
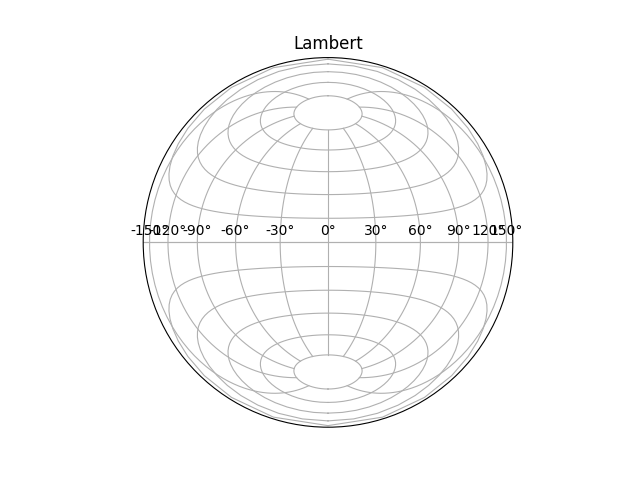
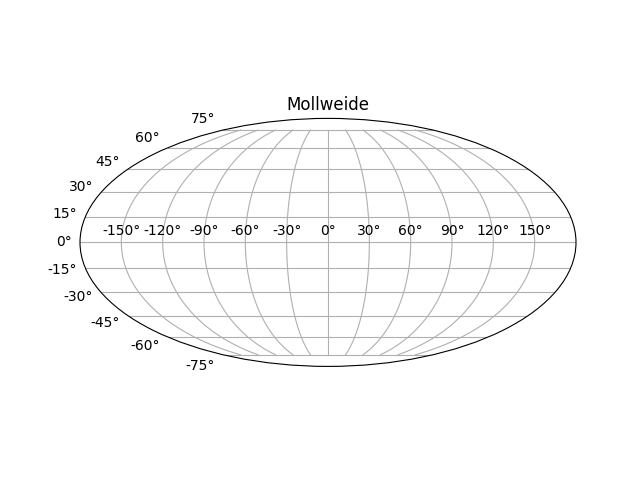
Cela montre 4 projections géographiques possibles. Cartopy prend en charge plus de projections.
import matplotlib.pyplot as plt
plt.figure()
plt.subplot(projection="aitoff")
plt.title("Aitoff")
plt.grid(True)

plt.figure()
plt.subplot(projection="hammer")
plt.title("Hammer")
plt.grid(True)

plt.figure()
plt.subplot(projection="lambert")
plt.title("Lambert")
plt.grid(True)

plt.figure()
plt.subplot(projection="mollweide")
plt.title("Mollweide")
plt.grid(True)

plt.show()

Durée totale d'exécution du script : (0 minutes 1,707 secondes)