Noter
Cliquez ici pour télécharger l'exemple de code complet
Créer des heatmaps annotées #
Il est souvent souhaitable d'afficher des données qui dépendent de deux variables indépendantes sous la forme d'un tracé d'image à code couleur. Ceci est souvent appelé une carte thermique. Si les données sont catégorielles, cela s'appellerait une carte thermique catégorique.
La fonction de Matplotlib imshowrend la production de tels tracés particulièrement facile.
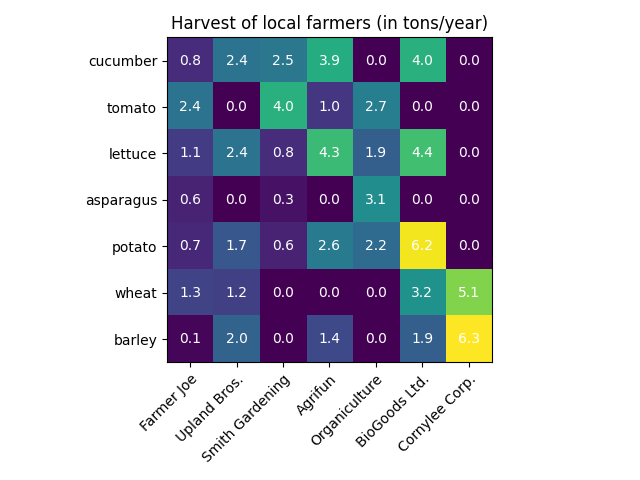
Les exemples suivants montrent comment créer une carte thermique avec des annotations. Nous allons commencer par un exemple simple et le développer pour qu'il soit utilisable en tant que fonction universelle.
Une simple carte thermique catégorielle #
Nous pouvons commencer par définir certaines données. Ce dont nous avons besoin est une liste ou un tableau 2D qui définit les données avec un code couleur. Nous avons alors également besoin de deux listes ou tableaux de catégories ; bien sûr, le nombre d'éléments dans ces listes doit correspondre aux données le long des axes respectifs. La carte thermique elle-même est un imshowtracé avec les étiquettes définies sur les catégories que nous avons. Notez qu'il est important de définir à la fois les emplacements des ticks ( set_xticks) ainsi que les étiquettes des ticks ( set_xticklabels), sinon ils seraient désynchronisés. Les emplacements ne sont que des nombres entiers croissants, tandis que les ticklabels sont les étiquettes à afficher. Enfin, nous pouvons étiqueter les données elles-mêmes en créant un Text
dans chaque cellule indiquant la valeur de cette cellule.
import numpy as np
import matplotlib
import matplotlib as mpl
import matplotlib.pyplot as plt

vegetables = ["cucumber", "tomato", "lettuce", "asparagus",
              "potato", "wheat", "barley"]
farmers = ["Farmer Joe", "Upland Bros.", "Smith Gardening",
           "Agrifun", "Organiculture", "BioGoods Ltd.", "Cornylee Corp."]

harvest = np.array([[0.8, 2.4, 2.5, 3.9, 0.0, 4.0, 0.0],
                    [2.4, 0.0, 4.0, 1.0, 2.7, 0.0, 0.0],
                    [1.1, 2.4, 0.8, 4.3, 1.9, 4.4, 0.0],
                    [0.6, 0.0, 0.3, 0.0, 3.1, 0.0, 0.0],
                    [0.7, 1.7, 0.6, 2.6, 2.2, 6.2, 0.0],
                    [1.3, 1.2, 0.0, 0.0, 0.0, 3.2, 5.1],
                    [0.1, 2.0, 0.0, 1.4, 0.0, 1.9, 6.3]])


fig, ax = plt.subplots()
im = ax.imshow(harvest)

# Show all ticks and label them with the respective list entries
ax.set_xticks(np.arange(len(farmers)), labels=farmers)
ax.set_yticks(np.arange(len(vegetables)), labels=vegetables)

# Rotate the tick labels and set their alignment.
plt.setp(ax.get_xticklabels(), rotation=45, ha="right",
         rotation_mode="anchor")

# Loop over data dimensions and create text annotations.
for i in range(len(vegetables)):
    for j in range(len(farmers)):
        text = ax.text(j, i, harvest[i, j],
                       ha="center", va="center", color="w")

ax.set_title("Harvest of local farmers (in tons/year)")
fig.tight_layout()
plt.show()

Utilisation du style de code de fonction d'assistance #
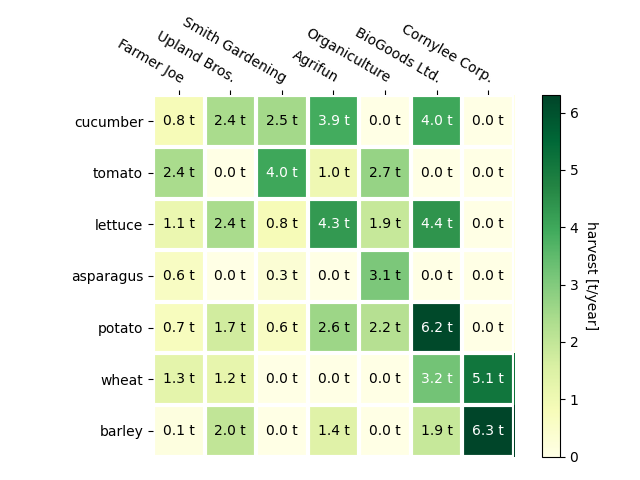
Comme indiqué dans les styles de codage, on peut souhaiter réutiliser ce code pour créer une sorte de carte thermique pour différentes données d'entrée et/ou sur différents axes. Nous créons une fonction qui prend les données et les étiquettes de ligne et de colonne en entrée, et autorise les arguments utilisés pour personnaliser le tracé
Ici, en plus de ce qui précède, nous souhaitons également créer une barre de couleurs et positionner les étiquettes au-dessus de la carte thermique au lieu d'en dessous. Les annotations doivent obtenir des couleurs différentes en fonction d'un seuil pour un meilleur contraste par rapport à la couleur du pixel. Enfin, nous désactivons les épines des axes environnants et créons une grille de lignes blanches pour séparer les cellules.
def heatmap(data, row_labels, col_labels, ax=None,
            cbar_kw=None, cbarlabel="", **kwargs):
    """
    Create a heatmap from a numpy array and two lists of labels.

    Parameters
    ----------
    data
        A 2D numpy array of shape (M, N).
    row_labels
        A list or array of length M with the labels for the rows.
    col_labels
        A list or array of length N with the labels for the columns.
    ax
        A `matplotlib.axes.Axes` instance to which the heatmap is plotted.  If
        not provided, use current axes or create a new one.  Optional.
    cbar_kw
        A dictionary with arguments to `matplotlib.Figure.colorbar`.  Optional.
    cbarlabel
        The label for the colorbar.  Optional.
    **kwargs
        All other arguments are forwarded to `imshow`.
    """

    if ax is None:
        ax = plt.gca()

    if cbar_kw is None:
        cbar_kw = {}

    # Plot the heatmap
    im = ax.imshow(data, **kwargs)

    # Create colorbar
    cbar = ax.figure.colorbar(im, ax=ax, **cbar_kw)
    cbar.ax.set_ylabel(cbarlabel, rotation=-90, va="bottom")

    # Show all ticks and label them with the respective list entries.
    ax.set_xticks(np.arange(data.shape[1]), labels=col_labels)
    ax.set_yticks(np.arange(data.shape[0]), labels=row_labels)

    # Let the horizontal axes labeling appear on top.
    ax.tick_params(top=True, bottom=False,
                   labeltop=True, labelbottom=False)

    # Rotate the tick labels and set their alignment.
    plt.setp(ax.get_xticklabels(), rotation=-30, ha="right",
             rotation_mode="anchor")

    # Turn spines off and create white grid.
    ax.spines[:].set_visible(False)

    ax.set_xticks(np.arange(data.shape[1]+1)-.5, minor=True)
    ax.set_yticks(np.arange(data.shape[0]+1)-.5, minor=True)
    ax.grid(which="minor", color="w", linestyle='-', linewidth=3)
    ax.tick_params(which="minor", bottom=False, left=False)

    return im, cbar


def annotate_heatmap(im, data=None, valfmt="{x:.2f}",
                     textcolors=("black", "white"),
                     threshold=None, **textkw):
    """
    A function to annotate a heatmap.

    Parameters
    ----------
    im
        The AxesImage to be labeled.
    data
        Data used to annotate.  If None, the image's data is used.  Optional.
    valfmt
        The format of the annotations inside the heatmap.  This should either
        use the string format method, e.g. "$ {x:.2f}", or be a
        `matplotlib.ticker.Formatter`.  Optional.
    textcolors
        A pair of colors.  The first is used for values below a threshold,
        the second for those above.  Optional.
    threshold
        Value in data units according to which the colors from textcolors are
        applied.  If None (the default) uses the middle of the colormap as
        separation.  Optional.
    **kwargs
        All other arguments are forwarded to each call to `text` used to create
        the text labels.
    """

    if not isinstance(data, (list, np.ndarray)):
        data = im.get_array()

    # Normalize the threshold to the images color range.
    if threshold is not None:
        threshold = im.norm(threshold)
    else:
        threshold = im.norm(data.max())/2.

    # Set default alignment to center, but allow it to be
    # overwritten by textkw.
    kw = dict(horizontalalignment="center",
              verticalalignment="center")
    kw.update(textkw)

    # Get the formatter in case a string is supplied
    if isinstance(valfmt, str):
        valfmt = matplotlib.ticker.StrMethodFormatter(valfmt)

    # Loop over the data and create a `Text` for each "pixel".
    # Change the text's color depending on the data.
    texts = []
    for i in range(data.shape[0]):
        for j in range(data.shape[1]):
            kw.update(color=textcolors[int(im.norm(data[i, j]) > threshold)])
            text = im.axes.text(j, i, valfmt(data[i, j], None), **kw)
            texts.append(text)

    return texts
Ce qui précède nous permet maintenant de garder la création de l'intrigue réelle assez compacte.
fig, ax = plt.subplots()

im, cbar = heatmap(harvest, vegetables, farmers, ax=ax,
                   cmap="YlGn", cbarlabel="harvest [t/year]")
texts = annotate_heatmap(im, valfmt="{x:.1f} t")

fig.tight_layout()
plt.show()

Quelques exemples de cartes thermiques plus complexes #
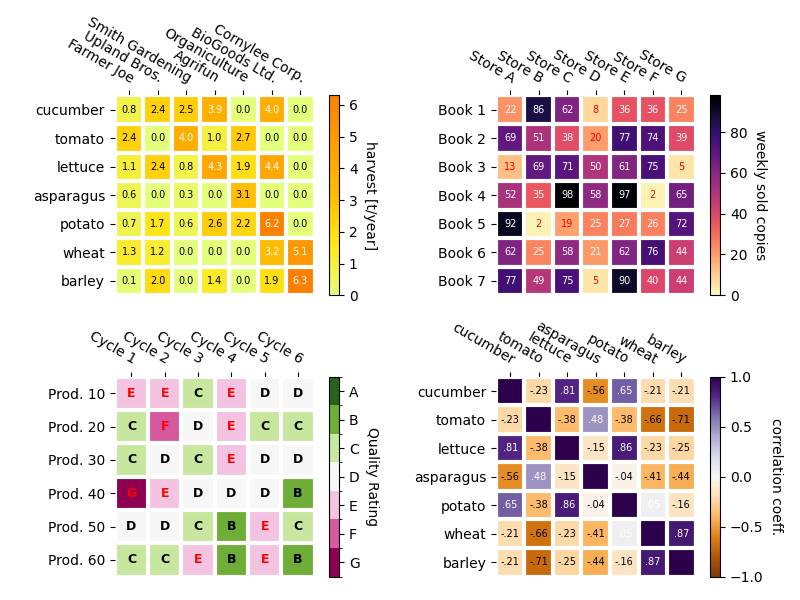
Dans ce qui suit, nous montrons la versatilité des fonctions créées précédemment en l'appliquant dans différents cas et en utilisant différents arguments.
np.random.seed(19680801)

fig, ((ax, ax2), (ax3, ax4)) = plt.subplots(2, 2, figsize=(8, 6))

# Replicate the above example with a different font size and colormap.

im, _ = heatmap(harvest, vegetables, farmers, ax=ax,
                cmap="Wistia", cbarlabel="harvest [t/year]")
annotate_heatmap(im, valfmt="{x:.1f}", size=7)

# Create some new data, give further arguments to imshow (vmin),
# use an integer format on the annotations and provide some colors.

data = np.random.randint(2, 100, size=(7, 7))
y = ["Book {}".format(i) for i in range(1, 8)]
x = ["Store {}".format(i) for i in list("ABCDEFG")]
im, _ = heatmap(data, y, x, ax=ax2, vmin=0,
                cmap="magma_r", cbarlabel="weekly sold copies")
annotate_heatmap(im, valfmt="{x:d}", size=7, threshold=20,
                 textcolors=("red", "white"))

# Sometimes even the data itself is categorical. Here we use a
# `matplotlib.colors.BoundaryNorm` to get the data into classes
# and use this to colorize the plot, but also to obtain the class
# labels from an array of classes.

data = np.random.randn(6, 6)
y = ["Prod. {}".format(i) for i in range(10, 70, 10)]
x = ["Cycle {}".format(i) for i in range(1, 7)]

qrates = list("ABCDEFG")
norm = matplotlib.colors.BoundaryNorm(np.linspace(-3.5, 3.5, 8), 7)
fmt = matplotlib.ticker.FuncFormatter(lambda x, pos: qrates[::-1][norm(x)])

im, _ = heatmap(data, y, x, ax=ax3,
                cmap=mpl.colormaps["PiYG"].resampled(7), norm=norm,
                cbar_kw=dict(ticks=np.arange(-3, 4), format=fmt),
                cbarlabel="Quality Rating")

annotate_heatmap(im, valfmt=fmt, size=9, fontweight="bold", threshold=-1,
                 textcolors=("red", "black"))

# We can nicely plot a correlation matrix. Since this is bound by -1 and 1,
# we use those as vmin and vmax. We may also remove leading zeros and hide
# the diagonal elements (which are all 1) by using a
# `matplotlib.ticker.FuncFormatter`.

corr_matrix = np.corrcoef(harvest)
im, _ = heatmap(corr_matrix, vegetables, vegetables, ax=ax4,
                cmap="PuOr", vmin=-1, vmax=1,
                cbarlabel="correlation coeff.")


def func(x, pos):
    return "{:.2f}".format(x).replace("0.", ".").replace("1.00", "")

annotate_heatmap(im, valfmt=matplotlib.ticker.FuncFormatter(func), size=7)


plt.tight_layout()
plt.show()

Références
L'utilisation des fonctions, méthodes, classes et modules suivants est illustrée dans cet exemple :
Durée totale d'exécution du script : (0 minutes 2,652 secondes)