Noter
Cliquez ici pour télécharger l'exemple de code complet
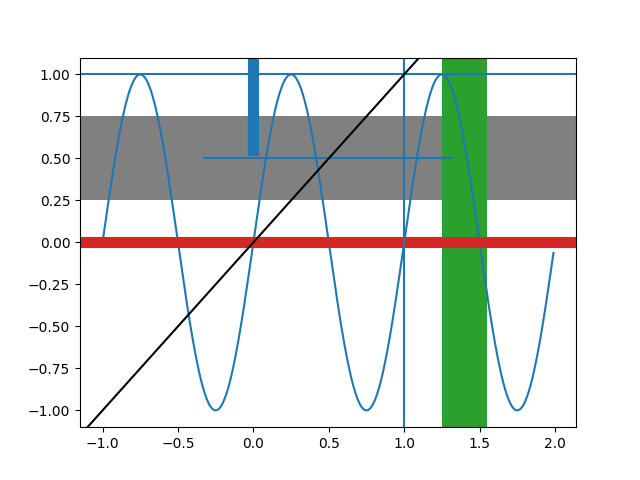
Démo axhspan #
Créez des lignes ou des rectangles qui s'étendent sur les axes dans la direction horizontale ou verticale, et des lignes qui s'étendent sur les axes avec une orientation arbitraire.
import numpy as np
import matplotlib.pyplot as plt

t = np.arange(-1, 2, .01)
s = np.sin(2 * np.pi * t)

fig, ax = plt.subplots()

ax.plot(t, s)
# Thick red horizontal line at y=0 that spans the xrange.
ax.axhline(linewidth=8, color='#d62728')
# Horizontal line at y=1 that spans the xrange.
ax.axhline(y=1)
# Vertical line at x=1 that spans the yrange.
ax.axvline(x=1)
# Thick blue vertical line at x=0 that spans the upper quadrant of the yrange.
ax.axvline(x=0, ymin=0.75, linewidth=8, color='#1f77b4')
# Default hline at y=.5 that spans the middle half of the axes.
ax.axhline(y=.5, xmin=0.25, xmax=0.75)
# Infinite black line going through (0, 0) to (1, 1).
ax.axline((0, 0), (1, 1), color='k')
# 50%-gray rectangle spanning the axes' width from y=0.25 to y=0.75.
ax.axhspan(0.25, 0.75, facecolor='0.5')
# Green rectangle spanning the axes' height from x=1.25 to x=1.55.
ax.axvspan(1.25, 1.55, facecolor='#2ca02c')

plt.show()