Noter
Cliquez ici pour télécharger l'exemple de code complet
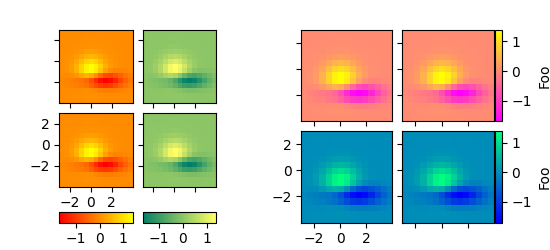
Barres de couleurs par ligne ou par colonne #
Cet exemple montre comment utiliser une barre de couleurs commune pour chaque ligne ou colonne d'une grille d'image.
from matplotlib import cbook
import matplotlib.pyplot as plt
from mpl_toolkits.axes_grid1 import AxesGrid


def get_demo_image():
    z = cbook.get_sample_data("axes_grid/bivariate_normal.npy", np_load=True)
    # z is a numpy array of 15x15
    return z, (-3, 4, -4, 3)


def demo_bottom_cbar(fig):
    """
    A grid of 2x2 images with a colorbar for each column.
    """
    grid = AxesGrid(fig, 121,  # similar to subplot(121)
                    nrows_ncols=(2, 2),
                    axes_pad=0.10,
                    share_all=True,
                    label_mode="1",
                    cbar_location="bottom",
                    cbar_mode="edge",
                    cbar_pad=0.25,
                    cbar_size="15%",
                    direction="column"
                    )

    Z, extent = get_demo_image()
    cmaps = ["autumn", "summer"]
    for i in range(4):
        im = grid[i].imshow(Z, extent=extent, cmap=cmaps[i//2])
        if i % 2:
            grid.cbar_axes[i//2].colorbar(im)

    for cax in grid.cbar_axes:
        cax.toggle_label(True)
        cax.axis[cax.orientation].set_label("Bar")

    # This affects all axes as share_all = True.
    grid.axes_llc.set_xticks([-2, 0, 2])
    grid.axes_llc.set_yticks([-2, 0, 2])


def demo_right_cbar(fig):
    """
    A grid of 2x2 images. Each row has its own colorbar.
    """
    grid = AxesGrid(fig, 122,  # similar to subplot(122)
                    nrows_ncols=(2, 2),
                    axes_pad=0.10,
                    label_mode="1",
                    share_all=True,
                    cbar_location="right",
                    cbar_mode="edge",
                    cbar_size="7%",
                    cbar_pad="2%",
                    )
    Z, extent = get_demo_image()
    cmaps = ["spring", "winter"]
    for i in range(4):
        im = grid[i].imshow(Z, extent=extent, cmap=cmaps[i//2])
        if i % 2:
            grid.cbar_axes[i//2].colorbar(im)

    for cax in grid.cbar_axes:
        cax.toggle_label(True)
        cax.axis[cax.orientation].set_label('Foo')

    # This affects all axes because we set share_all = True.
    grid.axes_llc.set_xticks([-2, 0, 2])
    grid.axes_llc.set_yticks([-2, 0, 2])


fig = plt.figure(figsize=(5.5, 2.5))
fig.subplots_adjust(left=0.05, right=0.93)

demo_bottom_cbar(fig)
demo_right_cbar(fig)

plt.show()