Noter
Cliquez ici pour télécharger l'exemple de code complet
Démo d'étiquette de barre #
Cet exemple montre comment utiliser la bar_labelfonction d'assistance pour créer des étiquettes de graphique à barres.
Voir également les exemples de diagramme à barres groupées , à barres empilées et à barres horizontales.
import matplotlib.pyplot as plt
import numpy as np
Définir les données
Diagramme à barres empilées avec barres d'erreur
fig, ax = plt.subplots()

p1 = ax.bar(ind, menMeans, width, yerr=menStd, label='Men')
p2 = ax.bar(ind, womenMeans, width,
            bottom=menMeans, yerr=womenStd, label='Women')

ax.axhline(0, color='grey', linewidth=0.8)
ax.set_ylabel('Scores')
ax.set_title('Scores by group and gender')
ax.set_xticks(ind, labels=['G1', 'G2', 'G3', 'G4', 'G5'])
ax.legend()

# Label with label_type 'center' instead of the default 'edge'
ax.bar_label(p1, label_type='center')
ax.bar_label(p2, label_type='center')
ax.bar_label(p2)

plt.show()
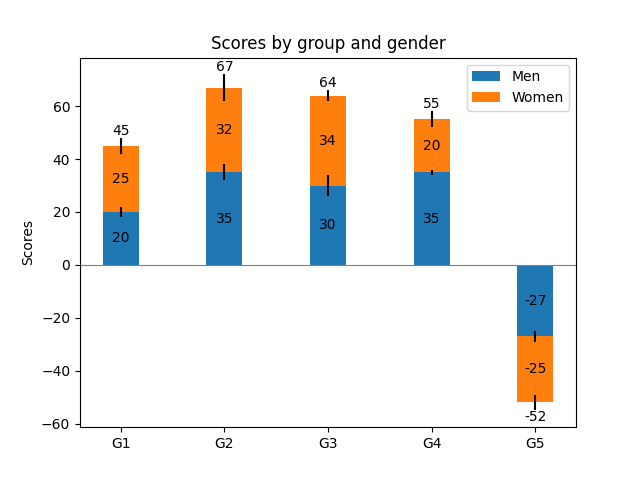
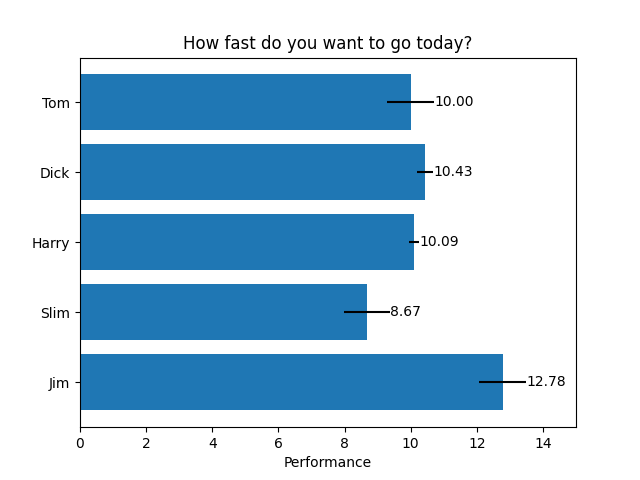
Diagramme à barres horizontales
# Fixing random state for reproducibility
np.random.seed(19680801)

# Example data
people = ('Tom', 'Dick', 'Harry', 'Slim', 'Jim')
y_pos = np.arange(len(people))
performance = 3 + 10 * np.random.rand(len(people))
error = np.random.rand(len(people))

fig, ax = plt.subplots()

hbars = ax.barh(y_pos, performance, xerr=error, align='center')
ax.set_yticks(y_pos, labels=people)
ax.invert_yaxis()  # labels read top-to-bottom
ax.set_xlabel('Performance')
ax.set_title('How fast do you want to go today?')

# Label with specially formatted floats
ax.bar_label(hbars, fmt='%.2f')
ax.set_xlim(right=15)  # adjust xlim to fit labels

plt.show()
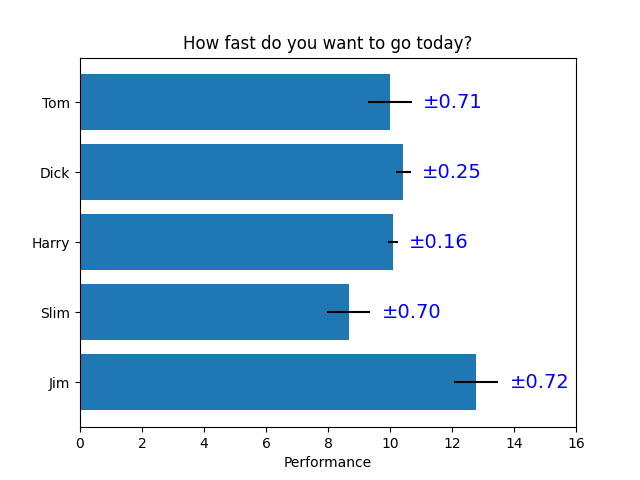
Certaines des choses les plus avancées que l'on peut faire avec les étiquettes de barre
fig, ax = plt.subplots()

hbars = ax.barh(y_pos, performance, xerr=error, align='center')
ax.set_yticks(y_pos, labels=people)
ax.invert_yaxis()  # labels read top-to-bottom
ax.set_xlabel('Performance')
ax.set_title('How fast do you want to go today?')

# Label with given captions, custom padding and annotate options
ax.bar_label(hbars, labels=['±%.2f' % e for e in error],
             padding=8, color='b', fontsize=14)
ax.set_xlim(right=16)

plt.show()
Références
L'utilisation des fonctions, méthodes, classes et modules suivants est illustrée dans cet exemple :
Durée totale d'exécution du script : ( 0 minutes 1.010 secondes)