Noter
Cliquez ici pour télécharger l'exemple de code complet
Légende Démo #
Tracer des légendes dans Matplotlib.
Il existe de nombreuses façons de créer et de personnaliser des légendes dans Matplotlib. Ci-dessous, nous allons montrer quelques exemples pour savoir comment procéder.
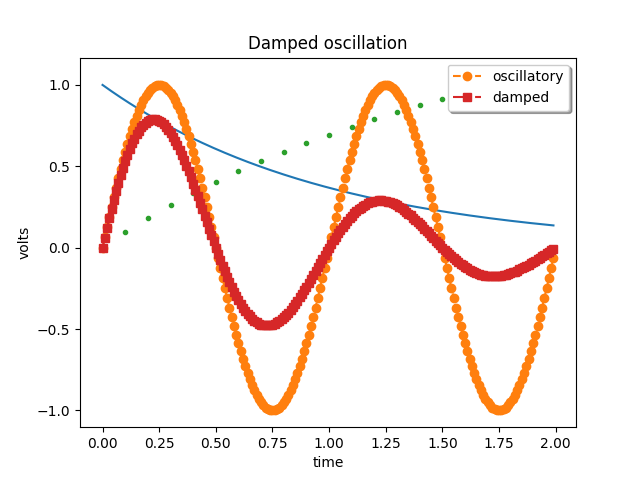
Nous allons d'abord montrer comment créer une légende pour des lignes spécifiques.
import matplotlib.pyplot as plt
import matplotlib.collections as mcol
from matplotlib.legend_handler import HandlerLineCollection, HandlerTuple
from matplotlib.lines import Line2D
import numpy as np

t1 = np.arange(0.0, 2.0, 0.1)
t2 = np.arange(0.0, 2.0, 0.01)

fig, ax = plt.subplots()

# note that plot returns a list of lines.  The "l1, = plot" usage
# extracts the first element of the list into l1 using tuple
# unpacking.  So l1 is a Line2D instance, not a sequence of lines
l1, = ax.plot(t2, np.exp(-t2))
l2, l3 = ax.plot(t2, np.sin(2 * np.pi * t2), '--o', t1, np.log(1 + t1), '.')
l4, = ax.plot(t2, np.exp(-t2) * np.sin(2 * np.pi * t2), 's-.')

ax.legend((l2, l4), ('oscillatory', 'damped'), loc='upper right', shadow=True)
ax.set_xlabel('time')
ax.set_ylabel('volts')
ax.set_title('Damped oscillation')
plt.show()
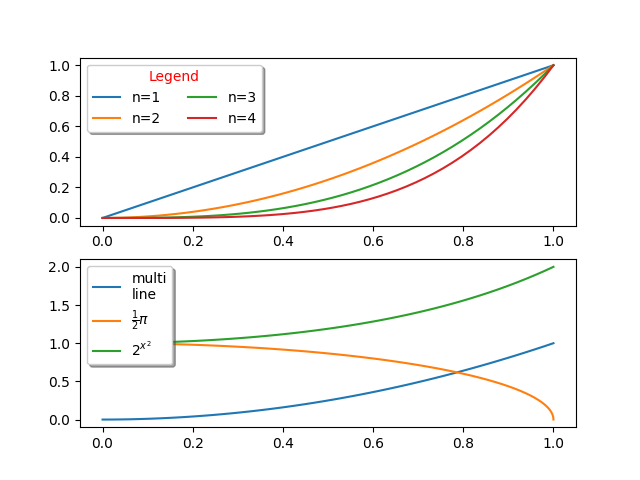
Ensuite, nous allons montrer comment tracer des étiquettes plus complexes.
x = np.linspace(0, 1)

fig, (ax0, ax1) = plt.subplots(2, 1)

# Plot the lines y=x**n for n=1..4.
for n in range(1, 5):
    ax0.plot(x, x**n, label="n={0}".format(n))
leg = ax0.legend(loc="upper left", bbox_to_anchor=[0, 1],
                 ncol=2, shadow=True, title="Legend", fancybox=True)
leg.get_title().set_color("red")

# Demonstrate some more complex labels.
ax1.plot(x, x**2, label="multi\nline")
half_pi = np.linspace(0, np.pi / 2)
ax1.plot(np.sin(half_pi), np.cos(half_pi), label=r"$\frac{1}{2}\pi$")
ax1.plot(x, 2**(x**2), label="$2^{x^2}$")
ax1.legend(shadow=True, fancybox=True)

plt.show()
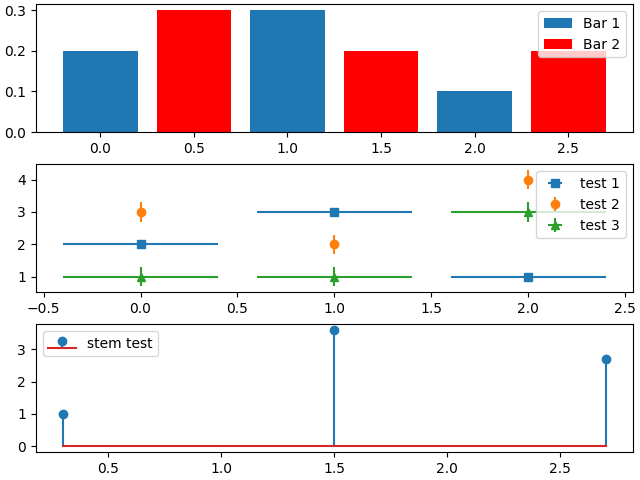
Ici, nous attachons des légendes à des tracés plus complexes.
fig, axs = plt.subplots(3, 1, constrained_layout=True)
top_ax, middle_ax, bottom_ax = axs

top_ax.bar([0, 1, 2], [0.2, 0.3, 0.1], width=0.4, label="Bar 1",
           align="center")
top_ax.bar([0.5, 1.5, 2.5], [0.3, 0.2, 0.2], color="red", width=0.4,
           label="Bar 2", align="center")
top_ax.legend()

middle_ax.errorbar([0, 1, 2], [2, 3, 1], xerr=0.4, fmt="s", label="test 1")
middle_ax.errorbar([0, 1, 2], [3, 2, 4], yerr=0.3, fmt="o", label="test 2")
middle_ax.errorbar([0, 1, 2], [1, 1, 3], xerr=0.4, yerr=0.3, fmt="^",
                   label="test 3")
middle_ax.legend()

bottom_ax.stem([0.3, 1.5, 2.7], [1, 3.6, 2.7], label="stem test")
bottom_ax.legend()

plt.show()
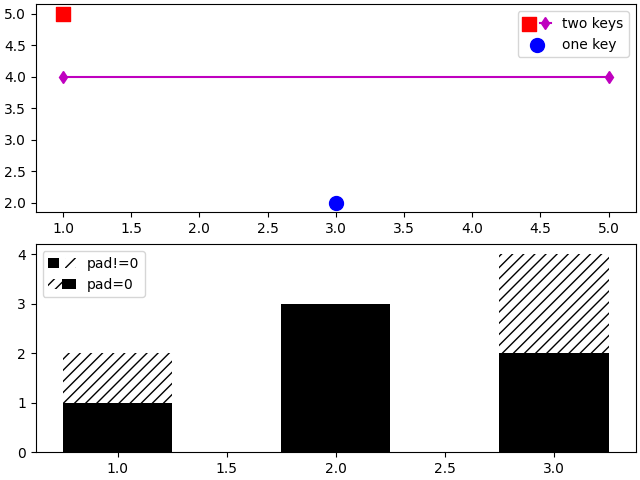
Nous allons maintenant présenter les entrées de légende avec plus d'une clé de légende.
fig, (ax1, ax2) = plt.subplots(2, 1, constrained_layout=True)

# First plot: two legend keys for a single entry
p1 = ax1.scatter([1], [5], c='r', marker='s', s=100)
p2 = ax1.scatter([3], [2], c='b', marker='o', s=100)
# `plot` returns a list, but we want the handle - thus the comma on the left
p3, = ax1.plot([1, 5], [4, 4], 'm-d')

# Assign two of the handles to the same legend entry by putting them in a tuple
# and using a generic handler map (which would be used for any additional
# tuples of handles like (p1, p3)).
l = ax1.legend([(p1, p3), p2], ['two keys', 'one key'], scatterpoints=1,
               numpoints=1, handler_map={tuple: HandlerTuple(ndivide=None)})

# Second plot: plot two bar charts on top of each other and change the padding
# between the legend keys
x_left = [1, 2, 3]
y_pos = [1, 3, 2]
y_neg = [2, 1, 4]

rneg = ax2.bar(x_left, y_neg, width=0.5, color='w', hatch='///', label='-1')
rpos = ax2.bar(x_left, y_pos, width=0.5, color='k', label='+1')

# Treat each legend entry differently by using specific `HandlerTuple`s
l = ax2.legend([(rpos, rneg), (rneg, rpos)], ['pad!=0', 'pad=0'],
               handler_map={(rpos, rneg): HandlerTuple(ndivide=None),
                            (rneg, rpos): HandlerTuple(ndivide=None, pad=0.)})
plt.show()
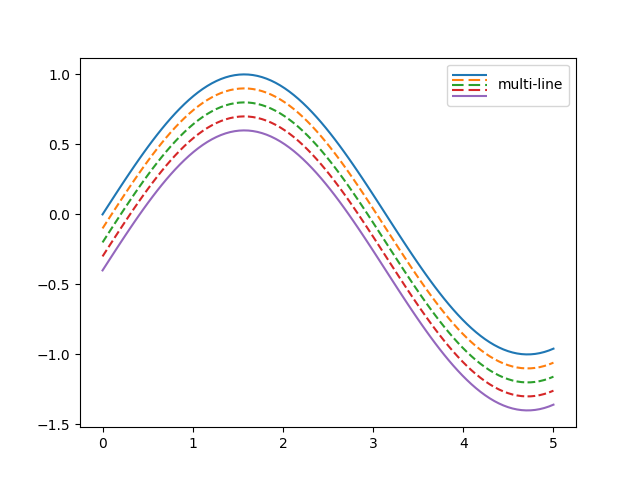
Enfin, il est également possible d'écrire des objets personnalisés qui définissent comment styliser les légendes.
class HandlerDashedLines(HandlerLineCollection):
    """
    Custom Handler for LineCollection instances.
    """
    def create_artists(self, legend, orig_handle,
                       xdescent, ydescent, width, height, fontsize, trans):
        # figure out how many lines there are
        numlines = len(orig_handle.get_segments())
        xdata, xdata_marker = self.get_xdata(legend, xdescent, ydescent,
                                             width, height, fontsize)
        leglines = []
        # divide the vertical space where the lines will go
        # into equal parts based on the number of lines
        ydata = np.full_like(xdata, height / (numlines + 1))
        # for each line, create the line at the proper location
        # and set the dash pattern
        for i in range(numlines):
            legline = Line2D(xdata, ydata * (numlines - i) - ydescent)
            self.update_prop(legline, orig_handle, legend)
            # set color, dash pattern, and linewidth to that
            # of the lines in linecollection
            try:
                color = orig_handle.get_colors()[i]
            except IndexError:
                color = orig_handle.get_colors()[0]
            try:
                dashes = orig_handle.get_dashes()[i]
            except IndexError:
                dashes = orig_handle.get_dashes()[0]
            try:
                lw = orig_handle.get_linewidths()[i]
            except IndexError:
                lw = orig_handle.get_linewidths()[0]
            if dashes[1] is not None:
                legline.set_dashes(dashes[1])
            legline.set_color(color)
            legline.set_transform(trans)
            legline.set_linewidth(lw)
            leglines.append(legline)
        return leglines

x = np.linspace(0, 5, 100)

fig, ax = plt.subplots()
colors = plt.rcParams['axes.prop_cycle'].by_key()['color'][:5]
styles = ['solid', 'dashed', 'dashed', 'dashed', 'solid']
lines = []
for i, color, style in zip(range(5), colors, styles):
    ax.plot(x, np.sin(x) - .1 * i, c=color, ls=style)

# make proxy artists
# make list of one line -- doesn't matter what the coordinates are
line = [[(0, 0)]]
# set up the proxy artist
lc = mcol.LineCollection(5 * line, linestyles=styles, colors=colors)
# create the legend
ax.legend([lc], ['multi-line'], handler_map={type(lc): HandlerDashedLines()},
          handlelength=2.5, handleheight=3)

plt.show()
Durée totale d'exécution du script : (0 minutes 2,626 secondes)