Noter
Cliquez ici pour télécharger l'exemple de code complet
Utiliser du texte accentué dans Matplotlib #
Matplotlib prend en charge les caractères accentués via TeX mathtext ou Unicode.
En utilisant mathtext, les accents suivants sont fournis : \hat, \breve, \grave, \bar, \acute, \tilde, \vec, \dot, \ddot. Tous ont la même syntaxe, par exemple \bar{o} donne "o overbar", \ddot{o} donne "o umlaut". Les raccourcis tels que \"o \'e \`e \~n \.x \^y sont également pris en charge.
import matplotlib.pyplot as plt
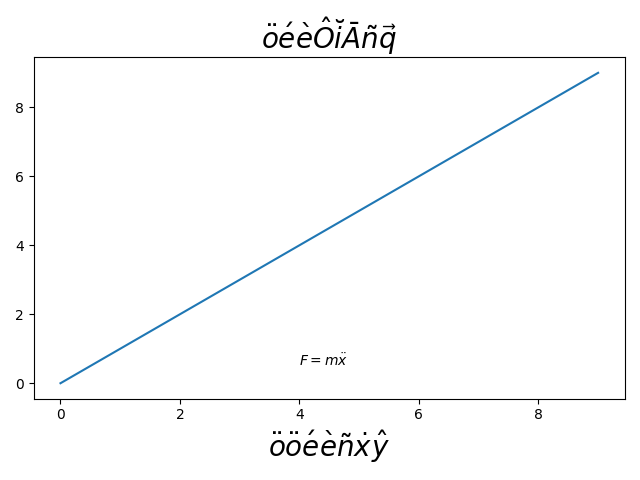
# Mathtext demo
fig, ax = plt.subplots()
ax.plot(range(10))
ax.set_title(r'$\ddot{o}\acute{e}\grave{e}\hat{O}'
r'\breve{i}\bar{A}\tilde{n}\vec{q}$', fontsize=20)
# Shorthand is also supported and curly braces are optional
ax.set_xlabel(r"""$\"o\ddot o \'e\`e\~n\.x\^y$""", fontsize=20)
ax.text(4, 0.5, r"$F=m\ddot{x}$")
fig.tight_layout()
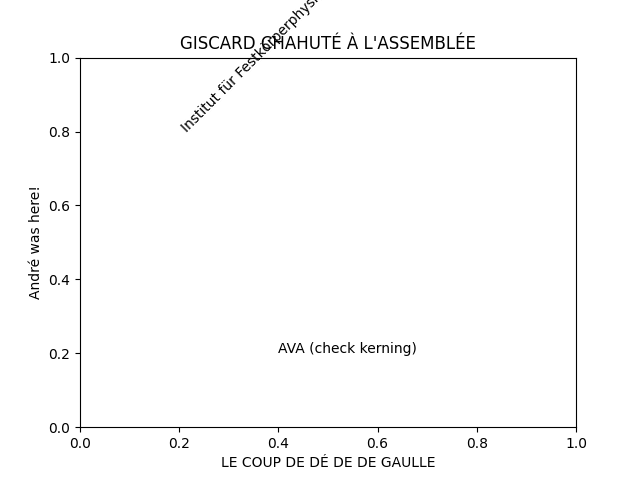
Vous pouvez également utiliser des caractères Unicode directement dans les chaînes.
fig, ax = plt.subplots()
ax.set_title("GISCARD CHAHUTÉ À L'ASSEMBLÉE")
ax.set_xlabel("LE COUP DE DÉ DE DE GAULLE")
ax.set_ylabel('André was here!')
ax.text(0.2, 0.8, 'Institut für Festkörperphysik', rotation=45)
ax.text(0.4, 0.2, 'AVA (check kerning)')

plt.show()