Noter
Cliquez ici pour télécharger l'exemple de code complet
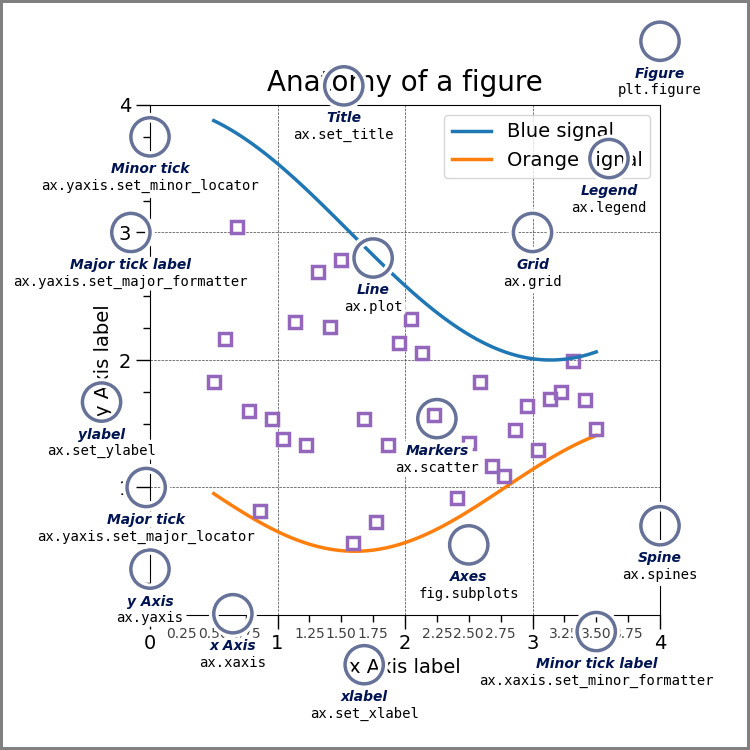
Anatomie d'une figure #
Cette figure montre le nom de plusieurs éléments matplotlib composant une figure
import numpy as np
import matplotlib.pyplot as plt
from matplotlib.patches import Circle
from matplotlib.patheffects import withStroke
from matplotlib.ticker import AutoMinorLocator, MultipleLocator

royal_blue = [0, 20/256, 82/256]


# make the figure

np.random.seed(19680801)

X = np.linspace(0.5, 3.5, 100)
Y1 = 3+np.cos(X)
Y2 = 1+np.cos(1+X/0.75)/2
Y3 = np.random.uniform(Y1, Y2, len(X))

fig = plt.figure(figsize=(7.5, 7.5))
ax = fig.add_axes([0.2, 0.17, 0.68, 0.7], aspect=1)

ax.xaxis.set_major_locator(MultipleLocator(1.000))
ax.xaxis.set_minor_locator(AutoMinorLocator(4))
ax.yaxis.set_major_locator(MultipleLocator(1.000))
ax.yaxis.set_minor_locator(AutoMinorLocator(4))
ax.xaxis.set_minor_formatter("{x:.2f}")

ax.set_xlim(0, 4)
ax.set_ylim(0, 4)

ax.tick_params(which='major', width=1.0, length=10, labelsize=14)
ax.tick_params(which='minor', width=1.0, length=5, labelsize=10,
               labelcolor='0.25')

ax.grid(linestyle="--", linewidth=0.5, color='.25', zorder=-10)

ax.plot(X, Y1, c='C0', lw=2.5, label="Blue signal", zorder=10)
ax.plot(X, Y2, c='C1', lw=2.5, label="Orange signal")
ax.plot(X[::3], Y3[::3], linewidth=0, markersize=9,
        marker='s', markerfacecolor='none', markeredgecolor='C4',
        markeredgewidth=2.5)

ax.set_title("Anatomy of a figure", fontsize=20, verticalalignment='bottom')
ax.set_xlabel("x Axis label", fontsize=14)
ax.set_ylabel("y Axis label", fontsize=14)
ax.legend(loc="upper right", fontsize=14)


# Annotate the figure

def annotate(x, y, text, code):
    # Circle marker
    c = Circle((x, y), radius=0.15, clip_on=False, zorder=10, linewidth=2.5,
               edgecolor=royal_blue + [0.6], facecolor='none',
               path_effects=[withStroke(linewidth=7, foreground='white')])
    ax.add_artist(c)

    # use path_effects as a background for the texts
    # draw the path_effects and the colored text separately so that the
    # path_effects cannot clip other texts
    for path_effects in [[withStroke(linewidth=7, foreground='white')], []]:
        color = 'white' if path_effects else royal_blue
        ax.text(x, y-0.2, text, zorder=100,
                ha='center', va='top', weight='bold', color=color,
                style='italic', fontfamily='Courier New',
                path_effects=path_effects)

        color = 'white' if path_effects else 'black'
        ax.text(x, y-0.33, code, zorder=100,
                ha='center', va='top', weight='normal', color=color,
                fontfamily='monospace', fontsize='medium',
                path_effects=path_effects)


annotate(3.5, -0.13, "Minor tick label", "ax.xaxis.set_minor_formatter")
annotate(-0.03, 1.0, "Major tick", "ax.yaxis.set_major_locator")
annotate(0.00, 3.75, "Minor tick", "ax.yaxis.set_minor_locator")
annotate(-0.15, 3.00, "Major tick label", "ax.yaxis.set_major_formatter")
annotate(1.68, -0.39, "xlabel", "ax.set_xlabel")
annotate(-0.38, 1.67, "ylabel", "ax.set_ylabel")
annotate(1.52, 4.15, "Title", "ax.set_title")
annotate(1.75, 2.80, "Line", "ax.plot")
annotate(2.25, 1.54, "Markers", "ax.scatter")
annotate(3.00, 3.00, "Grid", "ax.grid")
annotate(3.60, 3.58, "Legend", "ax.legend")
annotate(2.5, 0.55, "Axes", "fig.subplots")
annotate(4, 4.5, "Figure", "plt.figure")
annotate(0.65, 0.01, "x Axis", "ax.xaxis")
annotate(0, 0.36, "y Axis", "ax.yaxis")
annotate(4.0, 0.7, "Spine", "ax.spines")

# frame around figure
fig.patch.set(linewidth=4, edgecolor='0.5')
plt.show()
Références
L'utilisation des fonctions, méthodes, classes et modules suivants est illustrée dans cet exemple :
Durée totale d'exécution du script : (0 minutes 2,245 secondes)