Noter
Cliquez ici pour télécharger l'exemple de code complet
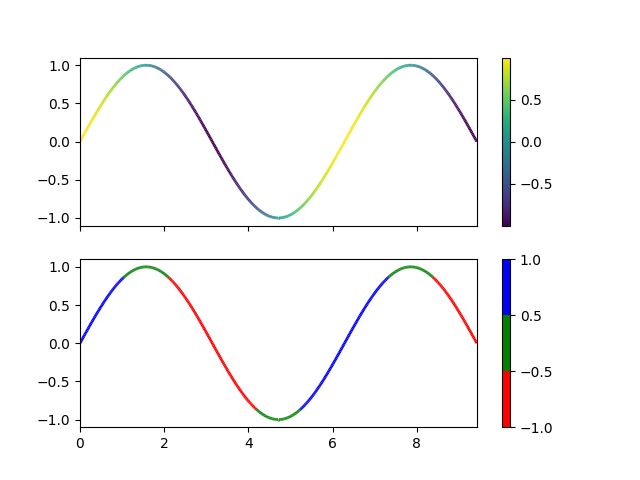
Lignes multicolores #
Cet exemple montre comment créer une ligne multicolore. Dans cet exemple, la ligne est colorée en fonction de sa dérivée.
import numpy as np
import matplotlib.pyplot as plt
from matplotlib.collections import LineCollection
from matplotlib.colors import ListedColormap, BoundaryNorm

x = np.linspace(0, 3 * np.pi, 500)
y = np.sin(x)
dydx = np.cos(0.5 * (x[:-1] + x[1:]))  # first derivative

# Create a set of line segments so that we can color them individually
# This creates the points as a N x 1 x 2 array so that we can stack points
# together easily to get the segments. The segments array for line collection
# needs to be (numlines) x (points per line) x 2 (for x and y)
points = np.array([x, y]).T.reshape(-1, 1, 2)
segments = np.concatenate([points[:-1], points[1:]], axis=1)

fig, axs = plt.subplots(2, 1, sharex=True, sharey=True)

# Create a continuous norm to map from data points to colors
norm = plt.Normalize(dydx.min(), dydx.max())
lc = LineCollection(segments, cmap='viridis', norm=norm)
# Set the values used for colormapping
lc.set_array(dydx)
lc.set_linewidth(2)
line = axs[0].add_collection(lc)
fig.colorbar(line, ax=axs[0])

# Use a boundary norm instead
cmap = ListedColormap(['r', 'g', 'b'])
norm = BoundaryNorm([-1, -0.5, 0.5, 1], cmap.N)
lc = LineCollection(segments, cmap=cmap, norm=norm)
lc.set_array(dydx)
lc.set_linewidth(2)
line = axs[1].add_collection(lc)
fig.colorbar(line, ax=axs[1])

axs[0].set_xlim(x.min(), x.max())
axs[0].set_ylim(-1.1, 1.1)
plt.show()