Noter
Cliquez ici pour télécharger l'exemple de code complet
Nuages de points avec légende #
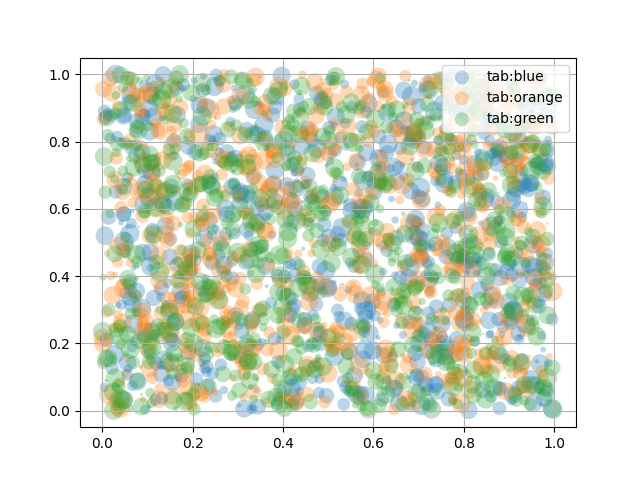
Pour créer un nuage de points avec une légende, on peut utiliser une boucle et créer un
scattertracé par élément pour qu'il apparaisse dans la légende et définir le en label
conséquence.
Ce qui suit montre également comment la transparence des marqueurs peut être ajustée en donnant alphaune valeur entre 0 et 1.
import numpy as np
import matplotlib.pyplot as plt

np.random.seed(19680801)


fig, ax = plt.subplots()
for color in ['tab:blue', 'tab:orange', 'tab:green']:
    n = 750
    x, y = np.random.rand(2, n)
    scale = 200.0 * np.random.rand(n)
    ax.scatter(x, y, c=color, s=scale, label=color,
               alpha=0.3, edgecolors='none')

ax.legend()
ax.grid(True)

plt.show()

Création de légende automatisée #
Une autre option pour créer une légende pour un nuage de points consiste à utiliser la
PathCollection.legend_elementsméthode . Il essaiera automatiquement de déterminer un nombre utile d'entrées de légende à afficher et renverra un tuple de poignées et d'étiquettes. Ceux-ci peuvent être transmis à l'appel à legend.
N = 45
x, y = np.random.rand(2, N)
c = np.random.randint(1, 5, size=N)
s = np.random.randint(10, 220, size=N)

fig, ax = plt.subplots()

scatter = ax.scatter(x, y, c=c, s=s)

# produce a legend with the unique colors from the scatter
legend1 = ax.legend(*scatter.legend_elements(),
                    loc="lower left", title="Classes")
ax.add_artist(legend1)

# produce a legend with a cross section of sizes from the scatter
handles, labels = scatter.legend_elements(prop="sizes", alpha=0.6)
legend2 = ax.legend(handles, labels, loc="upper right", title="Sizes")

plt.show()

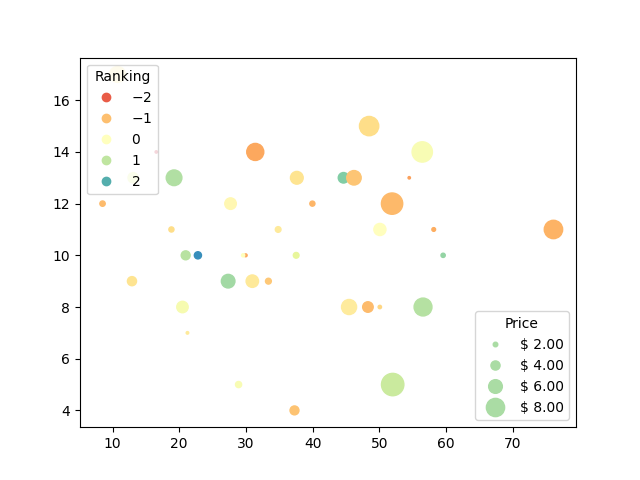
D'autres arguments de la PathCollection.legend_elementsméthode peuvent être utilisés pour déterminer le nombre d'entrées de légende à créer et la façon dont elles doivent être étiquetées. Ce qui suit montre comment utiliser certains d'entre eux.
volume = np.random.rayleigh(27, size=40)
amount = np.random.poisson(10, size=40)
ranking = np.random.normal(size=40)
price = np.random.uniform(1, 10, size=40)

fig, ax = plt.subplots()

# Because the price is much too small when being provided as size for ``s``,
# we normalize it to some useful point sizes, s=0.3*(price*3)**2
scatter = ax.scatter(volume, amount, c=ranking, s=0.3*(price*3)**2,
                     vmin=-3, vmax=3, cmap="Spectral")

# Produce a legend for the ranking (colors). Even though there are 40 different
# rankings, we only want to show 5 of them in the legend.
legend1 = ax.legend(*scatter.legend_elements(num=5),
                    loc="upper left", title="Ranking")
ax.add_artist(legend1)

# Produce a legend for the price (sizes). Because we want to show the prices
# in dollars, we use the *func* argument to supply the inverse of the function
# used to calculate the sizes from above. The *fmt* ensures to show the price
# in dollars. Note how we target at 5 elements here, but obtain only 4 in the
# created legend due to the automatic round prices that are chosen for us.
kw = dict(prop="sizes", num=5, color=scatter.cmap(0.7), fmt="$ {x:.2f}",
          func=lambda s: np.sqrt(s/.3)/3)
legend2 = ax.legend(*scatter.legend_elements(**kw),
                    loc="lower right", title="Price")

plt.show()

Références
L'utilisation des fonctions, méthodes, classes et modules suivants est illustrée dans cet exemple :
Durée totale d'exécution du script : ( 0 minutes 1.840 secondes)