Noter
Cliquez ici pour télécharger l'exemple de code complet
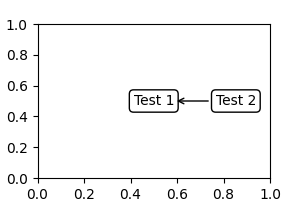
Annoter Simple Coord01 #
import matplotlib.pyplot as plt

fig, ax = plt.subplots(figsize=(3, 2))
an1 = ax.annotate("Test 1", xy=(0.5, 0.5), xycoords="data",
                  va="center", ha="center",
                  bbox=dict(boxstyle="round", fc="w"))
an2 = ax.annotate("Test 2", xy=(1, 0.5), xycoords=an1,
                  xytext=(30, 0), textcoords="offset points",
                  va="center", ha="left",
                  bbox=dict(boxstyle="round", fc="w"),
                  arrowprops=dict(arrowstyle="->"))
plt.show()