Noter
Cliquez ici pour télécharger l'exemple de code complet
Normalisations de la palette de couleurs #
Démonstration de l'utilisation de la norme pour mapper des palettes de couleurs sur des données de manière non linéaire.
import numpy as np
import matplotlib.pyplot as plt
import matplotlib.colors as colors
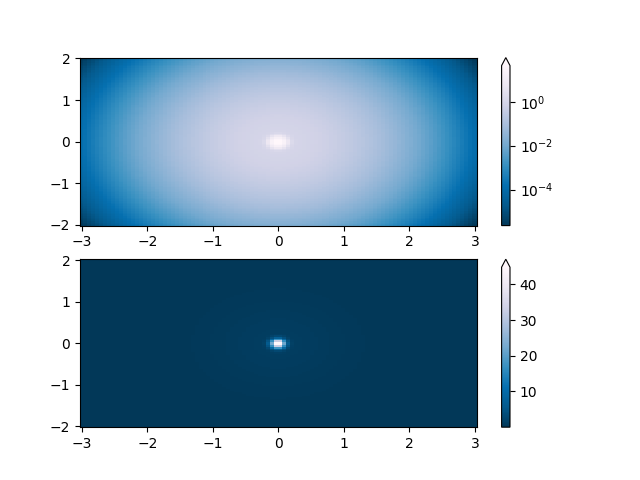
Lognorm : Au lieu de pcolor log10(Z1), vous pouvez avoir des barres de couleurs qui ont les étiquettes exponentielles en utilisant une norme.
N = 100
X, Y = np.mgrid[-3:3:complex(0, N), -2:2:complex(0, N)]

# A low hump with a spike coming out of the top.  Needs to have
# z/colour axis on a log scale so we see both hump and spike.  linear
# scale only shows the spike.

Z1 = np.exp(-X**2 - Y**2)
Z2 = np.exp(-(X * 10)**2 - (Y * 10)**2)
Z = Z1 + 50 * Z2

fig, ax = plt.subplots(2, 1)

pcm = ax[0].pcolor(X, Y, Z,
                   norm=colors.LogNorm(vmin=Z.min(), vmax=Z.max()),
                   cmap='PuBu_r', shading='nearest')
fig.colorbar(pcm, ax=ax[0], extend='max')

pcm = ax[1].pcolor(X, Y, Z, cmap='PuBu_r', shading='nearest')
fig.colorbar(pcm, ax=ax[1], extend='max')
<matplotlib.colorbar.Colorbar object at 0x7f2cfb030d90>
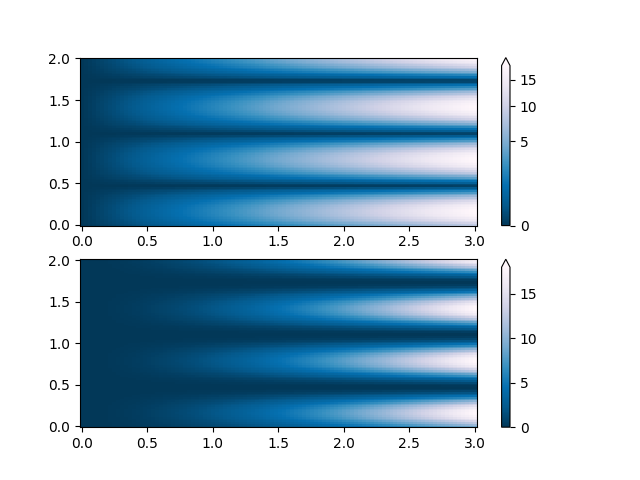
PowerNorm : Ici, une tendance de la loi de puissance en X masque partiellement une onde sinusoïdale rectifiée en Y. Nous pouvons supprimer la loi de puissance à l'aide d'une PowerNorm.
X, Y = np.mgrid[0:3:complex(0, N), 0:2:complex(0, N)]
Z1 = (1 + np.sin(Y * 10.)) * X**2

fig, ax = plt.subplots(2, 1)

pcm = ax[0].pcolormesh(X, Y, Z1, norm=colors.PowerNorm(gamma=1. / 2.),
                       cmap='PuBu_r', shading='nearest')
fig.colorbar(pcm, ax=ax[0], extend='max')

pcm = ax[1].pcolormesh(X, Y, Z1, cmap='PuBu_r', shading='nearest')
fig.colorbar(pcm, ax=ax[1], extend='max')
<matplotlib.colorbar.Colorbar object at 0x7f2cfb4f44c0>
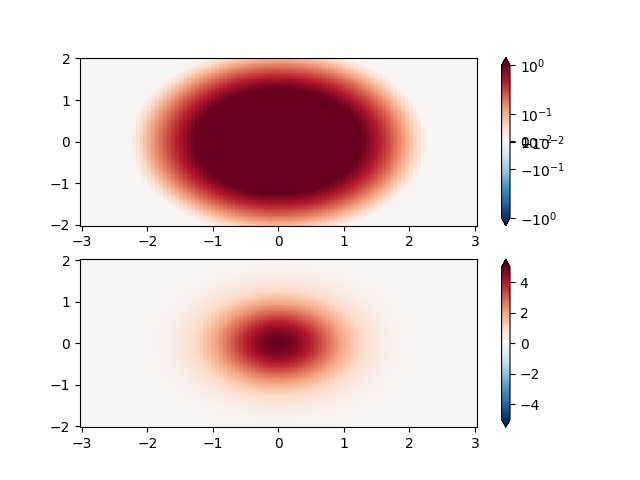
SymLogNorm : deux bosses, une négative et une positive, La positive avec 5 fois l'amplitude. Linéairement, vous ne pouvez pas voir les détails dans la bosse négative. Ici, nous mettons à l'échelle logarithmiquement les données positives et négatives séparément.
Notez que les étiquettes de la barre de couleurs ne sont pas très belles.
X, Y = np.mgrid[-3:3:complex(0, N), -2:2:complex(0, N)]
Z1 = 5 * np.exp(-X**2 - Y**2)
Z2 = np.exp(-(X - 1)**2 - (Y - 1)**2)
Z = (Z1 - Z2) * 2

fig, ax = plt.subplots(2, 1)

pcm = ax[0].pcolormesh(X, Y, Z1,
                       norm=colors.SymLogNorm(linthresh=0.03, linscale=0.03,
                                              vmin=-1.0, vmax=1.0, base=10),
                       cmap='RdBu_r', shading='nearest')
fig.colorbar(pcm, ax=ax[0], extend='both')

pcm = ax[1].pcolormesh(X, Y, Z1, cmap='RdBu_r', vmin=-np.max(Z1),
                       shading='nearest')
fig.colorbar(pcm, ax=ax[1], extend='both')
<matplotlib.colorbar.Colorbar object at 0x7f2cfb59c9a0>
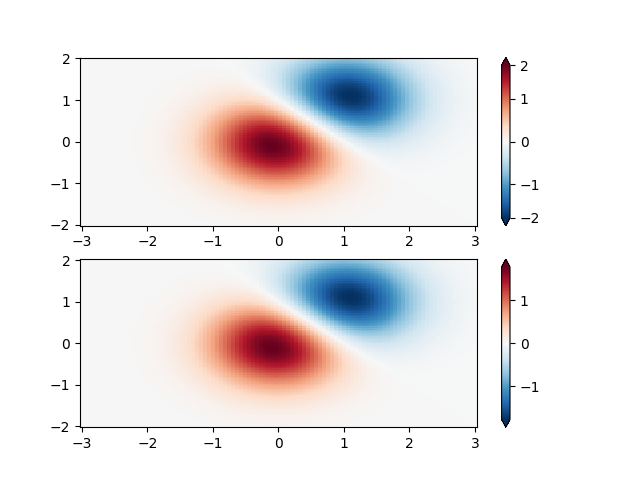
Norme personnalisée : un exemple avec une normalisation personnalisée. Celui-ci utilise l'exemple ci-dessus et normalise les données négatives différemment des positives.
X, Y = np.mgrid[-3:3:complex(0, N), -2:2:complex(0, N)]
Z1 = np.exp(-X**2 - Y**2)
Z2 = np.exp(-(X - 1)**2 - (Y - 1)**2)
Z = (Z1 - Z2) * 2

# Example of making your own norm.  Also see matplotlib.colors.
# From Joe Kington: This one gives two different linear ramps:


class MidpointNormalize(colors.Normalize):
    def __init__(self, vmin=None, vmax=None, midpoint=None, clip=False):
        self.midpoint = midpoint
        super().__init__(vmin, vmax, clip)

    def __call__(self, value, clip=None):
        # I'm ignoring masked values and all kinds of edge cases to make a
        # simple example...
        x, y = [self.vmin, self.midpoint, self.vmax], [0, 0.5, 1]
        return np.ma.masked_array(np.interp(value, x, y))


#####
fig, ax = plt.subplots(2, 1)

pcm = ax[0].pcolormesh(X, Y, Z,
                       norm=MidpointNormalize(midpoint=0.),
                       cmap='RdBu_r', shading='nearest')
fig.colorbar(pcm, ax=ax[0], extend='both')

pcm = ax[1].pcolormesh(X, Y, Z, cmap='RdBu_r', vmin=-np.max(Z),
                       shading='nearest')
fig.colorbar(pcm, ax=ax[1], extend='both')
<matplotlib.colorbar.Colorbar object at 0x7f2cfb533910>
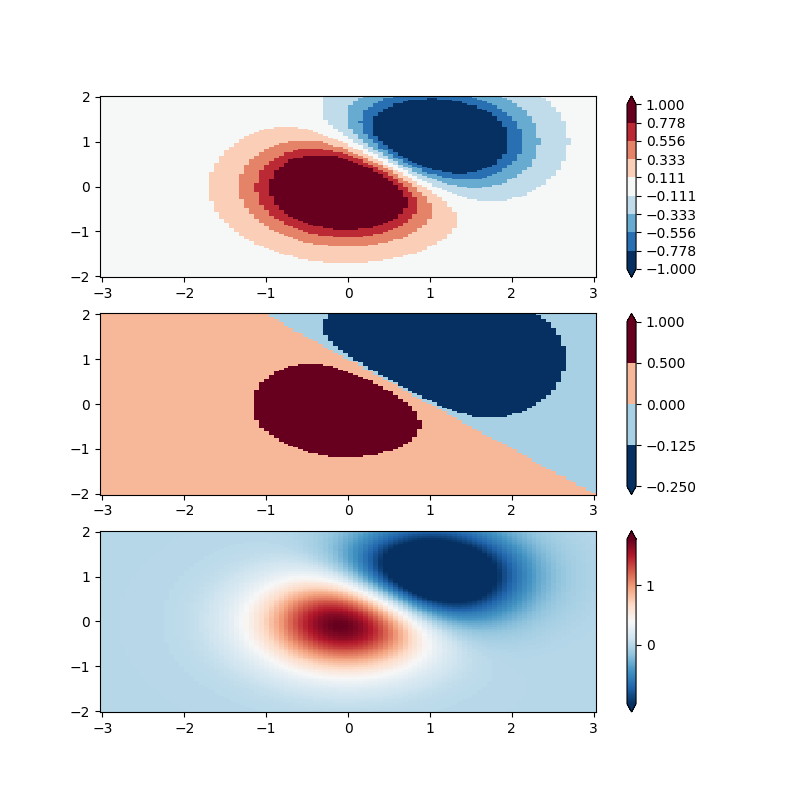
BoundaryNorm : pour celui-ci, vous fournissez les limites de vos couleurs, et la norme place la première couleur entre la première paire, la deuxième couleur entre la deuxième paire, etc.
fig, ax = plt.subplots(3, 1, figsize=(8, 8))
ax = ax.flatten()
# even bounds gives a contour-like effect
bounds = np.linspace(-1, 1, 10)
norm = colors.BoundaryNorm(boundaries=bounds, ncolors=256)
pcm = ax[0].pcolormesh(X, Y, Z,
                       norm=norm,
                       cmap='RdBu_r', shading='nearest')
fig.colorbar(pcm, ax=ax[0], extend='both', orientation='vertical')

# uneven bounds changes the colormapping:
bounds = np.array([-0.25, -0.125, 0, 0.5, 1])
norm = colors.BoundaryNorm(boundaries=bounds, ncolors=256)
pcm = ax[1].pcolormesh(X, Y, Z, norm=norm, cmap='RdBu_r', shading='nearest')
fig.colorbar(pcm, ax=ax[1], extend='both', orientation='vertical')

pcm = ax[2].pcolormesh(X, Y, Z, cmap='RdBu_r', vmin=-np.max(Z1),
                       shading='nearest')
fig.colorbar(pcm, ax=ax[2], extend='both', orientation='vertical')

plt.show()
Durée totale d'exécution du script : (0 minutes 3,715 secondes)