Noter
Cliquez ici pour télécharger l'exemple de code complet
Commandes de texte #
Traçage de texte de nombreux types différents.
import matplotlib.pyplot as plt

fig = plt.figure()
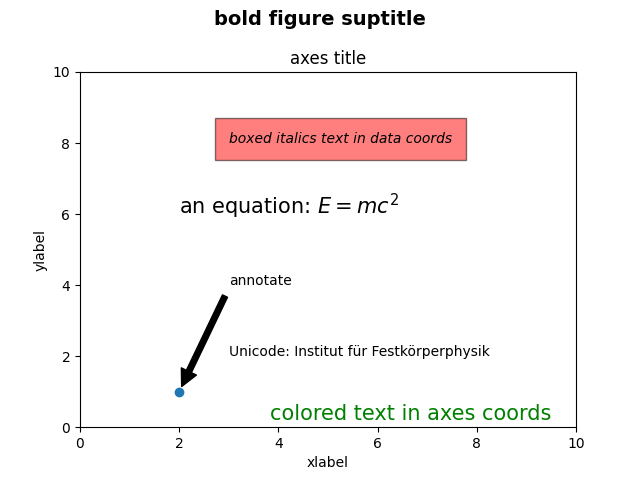
fig.suptitle('bold figure suptitle', fontsize=14, fontweight='bold')

ax = fig.add_subplot()
fig.subplots_adjust(top=0.85)
ax.set_title('axes title')

ax.set_xlabel('xlabel')
ax.set_ylabel('ylabel')

ax.text(3, 8, 'boxed italics text in data coords', style='italic',
        bbox={'facecolor': 'red', 'alpha': 0.5, 'pad': 10})

ax.text(2, 6, r'an equation: $E=mc^2$', fontsize=15)

ax.text(3, 2, 'Unicode: Institut f\374r Festk\366rperphysik')

ax.text(0.95, 0.01, 'colored text in axes coords',
        verticalalignment='bottom', horizontalalignment='right',
        transform=ax.transAxes,
        color='green', fontsize=15)


ax.plot([2], [1], 'o')
ax.annotate('annotate', xy=(2, 1), xytext=(3, 4),
            arrowprops=dict(facecolor='black', shrink=0.05))

ax.set(xlim=(0, 10), ylim=(0, 10))

plt.show()

Références
L'utilisation des fonctions, méthodes, classes et modules suivants est illustrée dans cet exemple :