Noter
Cliquez ici pour télécharger l'exemple de code complet
Cochez les formateurs #
Les formateurs de graduation définissent comment la valeur numérique associée à une graduation sur un axe est formatée en tant que chaîne.
Cet exemple illustre l'utilisation et l'effet des formateurs les plus courants.
import matplotlib.pyplot as plt
from matplotlib import ticker


def setup(ax, title):
    """Set up common parameters for the Axes in the example."""
    # only show the bottom spine
    ax.yaxis.set_major_locator(ticker.NullLocator())
    ax.spines.right.set_color('none')
    ax.spines.left.set_color('none')
    ax.spines.top.set_color('none')

    # define tick positions
    ax.xaxis.set_major_locator(ticker.MultipleLocator(1.00))
    ax.xaxis.set_minor_locator(ticker.MultipleLocator(0.25))

    ax.xaxis.set_ticks_position('bottom')
    ax.tick_params(which='major', width=1.00, length=5)
    ax.tick_params(which='minor', width=0.75, length=2.5, labelsize=10)
    ax.set_xlim(0, 5)
    ax.set_ylim(0, 1)
    ax.text(0.0, 0.2, title, transform=ax.transAxes,
            fontsize=14, fontname='Monospace', color='tab:blue')
Les formateurs de ticks peuvent être définis de deux manières, soit en passant une str
fonction ou à set_major_formatterou set_minor_formatter, soit en créant une instance de l'une des différentes Formatterclasses et en la fournissant à set_major_formatterou
set_minor_formatter.
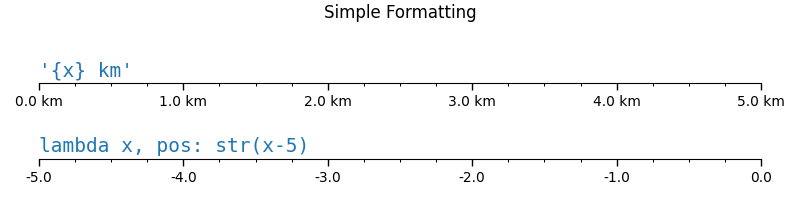
Les deux premiers exemples passent directement une strfonction ou .
fig0, axs0 = plt.subplots(2, 1, figsize=(8, 2))
fig0.suptitle('Simple Formatting')

# A ``str``, using format string function syntax, can be used directly as a
# formatter.  The variable ``x`` is the tick value and the variable ``pos`` is
# tick position.  This creates a StrMethodFormatter automatically.
setup(axs0[0], title="'{x} km'")
axs0[0].xaxis.set_major_formatter('{x} km')

# A function can also be used directly as a formatter. The function must take
# two arguments: ``x`` for the tick value and ``pos`` for the tick position,
# and must return a ``str``. This creates a FuncFormatter automatically.
setup(axs0[1], title="lambda x, pos: str(x-5)")
axs0[1].xaxis.set_major_formatter(lambda x, pos: str(x-5))

fig0.tight_layout()
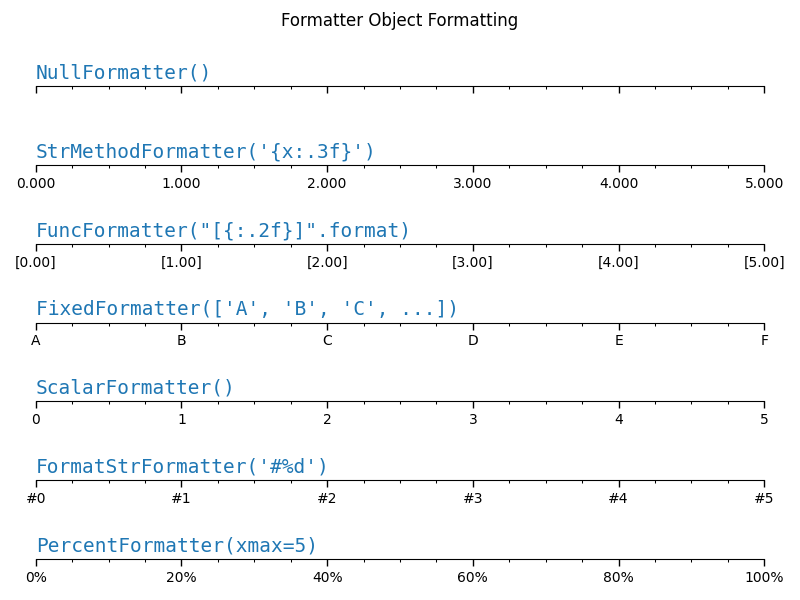
Les exemples restants utilisent des Formatterobjets.
fig1, axs1 = plt.subplots(7, 1, figsize=(8, 6))
fig1.suptitle('Formatter Object Formatting')

# Null formatter
setup(axs1[0], title="NullFormatter()")
axs1[0].xaxis.set_major_formatter(ticker.NullFormatter())

# StrMethod formatter
setup(axs1[1], title="StrMethodFormatter('{x:.3f}')")
axs1[1].xaxis.set_major_formatter(ticker.StrMethodFormatter("{x:.3f}"))


# FuncFormatter can be used as a decorator
@ticker.FuncFormatter
def major_formatter(x, pos):
    return f'[{x:.2f}]'


setup(axs1[2], title='FuncFormatter("[{:.2f}]".format)')
axs1[2].xaxis.set_major_formatter(major_formatter)

# Fixed formatter
setup(axs1[3], title="FixedFormatter(['A', 'B', 'C', ...])")
# FixedFormatter should only be used together with FixedLocator.
# Otherwise, one cannot be sure where the labels will end up.
positions = [0, 1, 2, 3, 4, 5]
labels = ['A', 'B', 'C', 'D', 'E', 'F']
axs1[3].xaxis.set_major_locator(ticker.FixedLocator(positions))
axs1[3].xaxis.set_major_formatter(ticker.FixedFormatter(labels))

# Scalar formatter
setup(axs1[4], title="ScalarFormatter()")
axs1[4].xaxis.set_major_formatter(ticker.ScalarFormatter(useMathText=True))

# FormatStr formatter
setup(axs1[5], title="FormatStrFormatter('#%d')")
axs1[5].xaxis.set_major_formatter(ticker.FormatStrFormatter("#%d"))

# Percent formatter
setup(axs1[6], title="PercentFormatter(xmax=5)")
axs1[6].xaxis.set_major_formatter(ticker.PercentFormatter(xmax=5))

fig1.tight_layout()
plt.show()
Références
L'utilisation des fonctions, méthodes, classes et modules suivants est illustrée dans cet exemple :
Durée totale d'exécution du script : (0 minutes 1,187 secondes)