Noter
Cliquez ici pour télécharger l'exemple de code complet
Démo CurveLinear Grid2 #
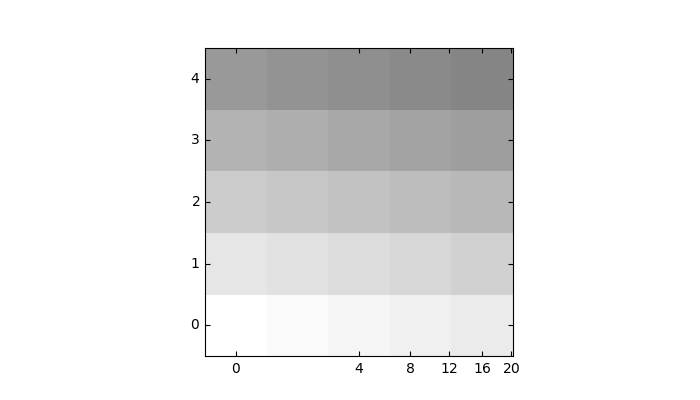
Grille et ticklines personnalisées.
Cet exemple montre comment utiliser GridHelperCurveLinear pour définir des grilles et des graduations personnalisées en appliquant une transformation sur la grille. Comme vitrine sur le tracé, une matrice 5x5 est affichée sur les axes.

import numpy as np
import matplotlib.pyplot as plt

from mpl_toolkits.axisartist.grid_helper_curvelinear import (
    GridHelperCurveLinear)
from mpl_toolkits.axisartist.grid_finder import (
    ExtremeFinderSimple, MaxNLocator)
from mpl_toolkits.axisartist.axislines import Axes


def curvelinear_test1(fig):
    """Grid for custom transform."""

    def tr(x, y):
        return np.sign(x)*abs(x)**.5, y

    def inv_tr(x, y):
        return np.sign(x)*x**2, y

    grid_helper = GridHelperCurveLinear(
        (tr, inv_tr),
        extreme_finder=ExtremeFinderSimple(20, 20),
        # better tick density
        grid_locator1=MaxNLocator(nbins=6), grid_locator2=MaxNLocator(nbins=6))

    ax1 = fig.add_subplot(axes_class=Axes, grid_helper=grid_helper)
    # ax1 will have a ticks and gridlines defined by the given
    # transform (+ transData of the Axes). Note that the transform of the Axes
    # itself (i.e., transData) is not affected by the given transform.

    ax1.imshow(np.arange(25).reshape(5, 5),
               vmax=50, cmap=plt.cm.gray_r, origin="lower")


if __name__ == "__main__":
    fig = plt.figure(figsize=(7, 4))
    curvelinear_test1(fig)
    plt.show()