Noter
Cliquez ici pour télécharger l'exemple de code complet
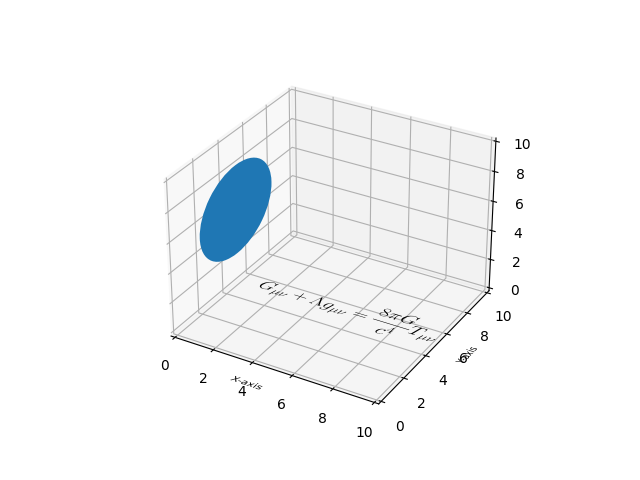
Dessinez des objets plats dans un tracé 3D #
Démontrez comment pathpatch_2d_to_3d« dessiner » des formes et du texte sur un tracé 3D.
import numpy as np
import matplotlib.pyplot as plt
from matplotlib.patches import Circle, PathPatch
from matplotlib.text import TextPath
from matplotlib.transforms import Affine2D
import mpl_toolkits.mplot3d.art3d as art3d


def text3d(ax, xyz, s, zdir="z", size=None, angle=0, usetex=False, **kwargs):
    """
    Plots the string *s* on the axes *ax*, with position *xyz*, size *size*,
    and rotation angle *angle*. *zdir* gives the axis which is to be treated as
    the third dimension. *usetex* is a boolean indicating whether the string
    should be run through a LaTeX subprocess or not.  Any additional keyword
    arguments are forwarded to `.transform_path`.

    Note: zdir affects the interpretation of xyz.
    """
    x, y, z = xyz
    if zdir == "y":
        xy1, z1 = (x, z), y
    elif zdir == "x":
        xy1, z1 = (y, z), x
    else:
        xy1, z1 = (x, y), z

    text_path = TextPath((0, 0), s, size=size, usetex=usetex)
    trans = Affine2D().rotate(angle).translate(xy1[0], xy1[1])

    p1 = PathPatch(trans.transform_path(text_path), **kwargs)
    ax.add_patch(p1)
    art3d.pathpatch_2d_to_3d(p1, z=z1, zdir=zdir)


fig = plt.figure()
ax = fig.add_subplot(projection='3d')

# Draw a circle on the x=0 'wall'
p = Circle((5, 5), 3)
ax.add_patch(p)
art3d.pathpatch_2d_to_3d(p, z=0, zdir="x")

# Manually label the axes
text3d(ax, (4, -2, 0), "X-axis", zdir="z", size=.5, usetex=False,
       ec="none", fc="k")
text3d(ax, (12, 4, 0), "Y-axis", zdir="z", size=.5, usetex=False,
       angle=np.pi / 2, ec="none", fc="k")
text3d(ax, (12, 10, 4), "Z-axis", zdir="y", size=.5, usetex=False,
       angle=np.pi / 2, ec="none", fc="k")

# Write a Latex formula on the z=0 'floor'
text3d(ax, (1, 5, 0),
       r"$\displaystyle G_{\mu\nu} + \Lambda g_{\mu\nu} = "
       r"\frac{8\pi G}{c^4} T_{\mu\nu}  $",
       zdir="z", size=1, usetex=True,
       ec="none", fc="k")

ax.set_xlim(0, 10)
ax.set_ylim(0, 10)
ax.set_zlim(0, 10)

plt.show()